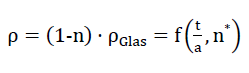
As the statements in chapter A of this dissertation show, the cell wall films of the real polyhedron foam glasses contain very many porous inclusions and can thus be idealised as spherical foam glass. For example the porosities n* of the cell wall films for the foam glass types 1 and 2 vary between 16 % and 42 %. It has also been shown, that the base material of the cell wall films equates to the standard compact glass, whose density can be assumed to be ρGlas=2.48.
In light of the above-mentioned facts and keeping in mind the objective of limiting the computational effort for the prediction of the mechanical properties of the polyhedron foam glass using a computer to a reasonable extent, in the future the cell wall films consisting of spherical foam glass will be treated as a continuum, which has the following mechanical properties:
- 1)
The uniaxial tensile strength of the continuum in planar
stress condition would have a value of
20)
- 2)
Its modulus of elasticity would have a value of
21)E(n∗)=E(n∗=0)e−3.95n∗
- 3)
The Poisson’s ratio of the continuum would be
22)ν(n∗)=ν(n∗=0)=0.21
In the above formulae nos. 20 to 22, with a view to the later application, the fracture mechanical and elastic characteristic values of the base material of the spherical foam glass films treated as a continuum are assumed as
- σGM(n∗=0)=90N / mm2
- E(n∗=0)=72´600N / mm2 und
- ν(n∗=0)=0.21 angenommen
These values correspond to a glass type which generally has the following chemical composition by percentage weights:
73 % SiO2, 15 % Na2O, 10 % CaO, 1 % Al2O3 und 0,05 % Fe2O3.
The mechanical material characteristic values determined experimentally in section No. 2 of this chapter were measured on test pieces which were extracted from samples expanded from waste glass powder corresponding roughly to the chemical composition above. For this reason, the above assumptions for the base material of the spherical foam glass films regarding a later comparison of the theoretically predicted and experimentally determined fracture strengths, moduli of elasticity and Poisson’s ratio seem sensible and reasonable.
Furthermore for the future determination of the fracture strengths of the polyhedron foam glass the hypothesis is created according to which the fracture in the polyhedron foam glass would start on the surface of that cell wall film of spherical foam glass with a porosity of n*, where the largest surface main tensile force anywhere in the foam glass exactly reaches the tensile strength
16a)
of the wall film set as a continuum.
Since as a consequence of the hypothesis in section No. 1.3.1 of this chapter the initial destruction of the polyhedron foam glass begin as a result of various external loadings on the surfaces of the spherical foam glass cell wall films treated as a continuum, the stress conditions on these surfaces should be understood as far as possible!
In order to determine these loading conditions with a sensible level of effort, for this reason the ideal foam glass mentioned in the section 1.4.1 of chapter A has been assumed, for which the centre surfaces of the cell wall films form a cell structure, which consists of many congruent Kelvin elementary polyhedra (also known as α - tetradecahedron). With this however, now all double-curved six-pointed side surfaces of its base polyhedron are deformed to planar surfaces. This operation results in a new polyhedron foam glass model, which is shown in the Figs. No. 11 and 12. The elementary polyhedra of the cell structure of the new polyhedron foam glass model now exists as many congruent truncated octahedrons (one of the thirteen Archimedean bodies). Their shape is shown in Fig. No. 13. For this reason, we want to term the model polyhedron foam glass as model foam glass “TOP” 1).
However in the model foam glass “TOP” the angles given from the conditions a) and b) of J. Plateau (see section 1.2 of chapter A) are no longer present! Since these deviations are only noticeable in close proximity to the “edges” of the Kelvin polyhedron, they can be neglected. The morphology of the individual truncated octahedrons, which are arranged as elementary polyhedra to form the model foam glass “TOP”, can be described by the symmetry of one of the 32 crystal classes (point groups) of crystallography (11).
- 1)"TOP" = abbreviation for "Truncated Octahedron Plateau". "Truncated Octahedron" is the English word for truncated octahedron.
Fig. No. 11 Layout and elevation of the model foam glass “TOP”
Fig. No. 12 Section B-B of the model foam glass “TOP”
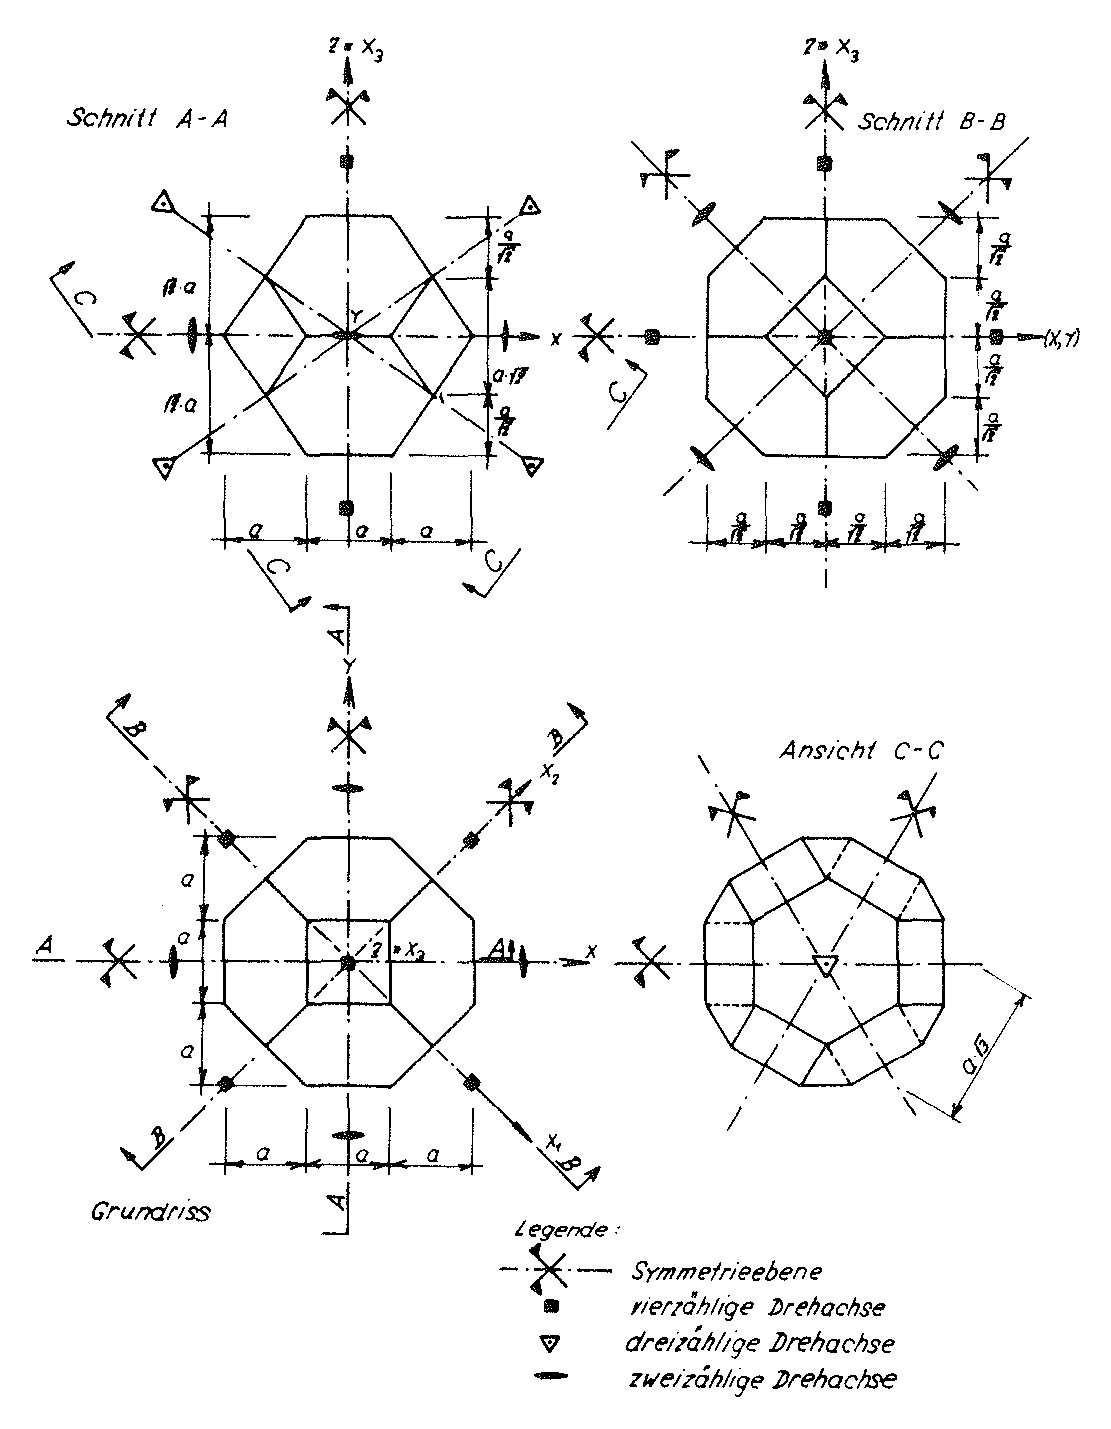
Fig. No. 13 The truncated octahedrons as elementary polyhedron of the “TOP” model foam glass
With the aid of Fig. no. 13 the symmetry elements of the point groups of these truncated octahedrons can be described in the following way:
- 1)The truncated octahedron possesses three four-fold rotational axes 1), which are arranged normal to eachother in pairs and are each determined by the centres of gravity of their opposite quadratic surfaces;
- 2)The polyhedron also has four four-fold rotational axes, whose position is fixed in each case by the centre of gravity of their opposite hexagonal surfaces;
- 3)The elementary polyhedron also has six two-fold rotational axes, which are determined by the centre points of the opposite cutting edges of each pair of its hexagonal surfaces;
- 4)The base polyhedron also has nine planes of symmetry which each stand perpendicular on its two- or four-fold rotational axes and always contain the centre of gravity; and
- 5)One centre of symmetry in the centre of gravity of the polyhedron.
The symmetry elements listed above form a point group or crystal class, which is generally referred to using the internationally used symbol m 3 m and is associated with the cubic crystal system. Since the hexakis octahedron as a general form also belongs to this crystal class, this class or point group can also be described using the synonym “hexakis octahedral class”.
The description of the “TOP” model foam glass with the Figs. No. 11 up to and including No. 13 shows, that as a result of the periodic structure of its cell structure all symmetry elements for its individually liberated base polyhedra just described above can also be transferred to the overall “TOP” model foam glass unconstrained on all sides. For this reason it is possible to state, that the cell structure of the “TOP” model foam glass also belongs to crystal class or point group m 3 m.
In section No. 1.3.2 of chapter A it was demonstrated using the example of the real polyhedron foam glass (also see Fig. No. 14), that where three cell wall films normally meet at the equilibrium angle of 120°, the
- 1)If after rotation with the angle α =
 around a straight line fixed to the body a body overlaps with itself, then this is known as an “n-fold rotational axis”.
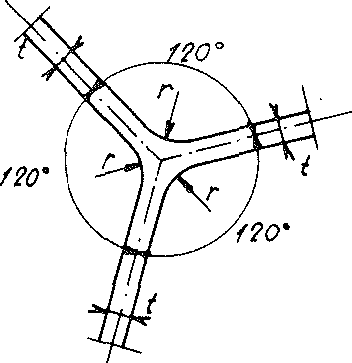
Fig. No. 14 The intersection area of three cell wall films
|
Fig. No. 14 The intersection area
of three cell wall films
|
surfaces are cylindrically rounded with so-called plateau edges, in the same section it was also determined that in real polyhedron foam glass the cell wall films can be assumed to consist of spherical foam glass. For this reason, from now on both of these facts are also taken into account.
For the “TOP” model foam glass a simple relationship exists between the geometry of the model and the porosity nz=n⋅ω , which is covered by all cell wall films of spherical foam glass.
On Fig. No. 13 of this section, an elementary polyhedron of our “TOP” model foam glass was shown, whose cell wall centre surfaces form a cell structure, which is comprised of many such congruent “truncated octahedrons”. Fig. No. 15 shows the section of this base polyhedron and its final sections with the (y - z) or (x - z) plane.
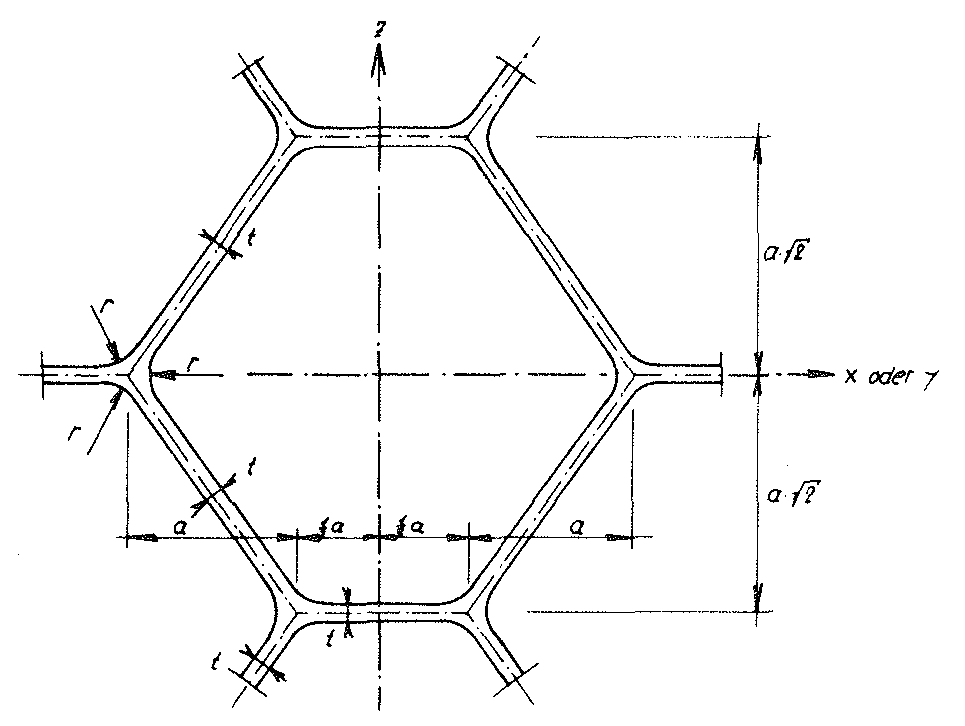
Fig. No. 15 Section of the base polyhedron of the “TOP” model foam glass with the xz- or yz- plane
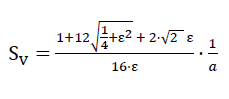
The centre surface of the spherical foam glass wall films related to the volume unit of the “TOP” model foam glass is
23)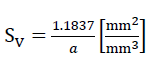
Here a refers to the edge length of the polyhedra of the cell structure, which form the centre surfaces of the cell wall films of the model foam glass.
If the plateau edges with radius r and penetration of each of the three cell wall films of thickness t in the area of their common “cutting lines” shown in Fig. No. 15 are neglected, the algebraic result is the component of the total porosity n = 1-  of a body from the “TOP” model foam glass, the gas phases included from the cell wall films from spherical foam glass is omitted to become
24)nZ=n⋅ω=1− SV⋅t
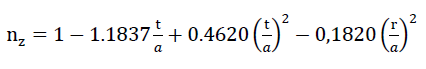
If however the volume proportion of the plateau edges shown in Fig. No. 15 is taken into account along with the influence of the overlaps of the cell wall films mentioned above, then two additional terms are added on the right hand side of the relationship above.! The porosity of the polyhedron-shaped gas bubbles included from the cell wall films then becomes
25)
The relationship between the porosity n of the “TOP” model foam glass and the parameters and n* defined in chapter A, section No. 2 is provided by the simple volumetric equation
26)n=n∗+(1−n∗)⋅nz
Despite the fact that the contour of the plateau edges added above really only depends on the gas bubble pressure and the surface stresses during the foam expansion process, the radii of the plateau edges assumed to be of circular cylinder shape arbitrarily become
r = 2 t
where t is the thickness of the assumed planar wall films of the model foam glass.
Justification:
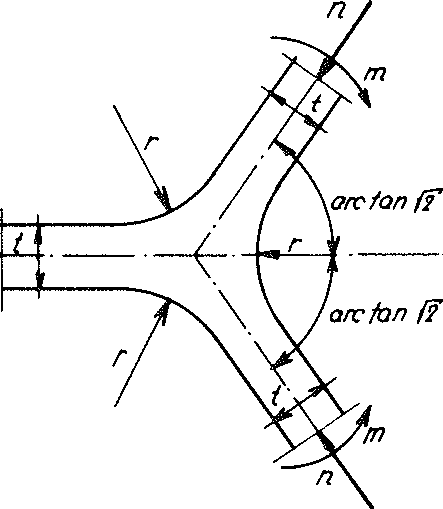
fig. No. 16 with intersecting forces of the loaded plateau edge
The influence of a bending moment m as well as a normal force n on the stress condition at the plateau edge (see diagram on Fig. No. 16) was investigated numerically based on a planar strain condition (PSC) in the normal plane to the intersection of the central planes of three cell wall films. The condition for a planar distortion state is certainly permissible, since the length a of the cutting line of the centre planes of any three neighbouring spherical foam wall films is much greater than their wall thickness t. The stress condition with this assumption r = 2 t was demonstrated to be balanced such that the notch effect of the plateau edge could be neglected.
If, conversely to the assumption above, r = 0, then according to Neuber this would result in α, form factor α, which with a bending moment m 1.62 and with the normal force n would equate to 1.69.
Conclusion from the assumption r = 2 t:
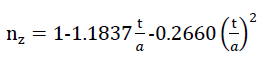
Since the using the assumption r - 2 t the above equation No. 25 becomes Expressions
27)
taking into account the relationship between the porosity n and the parameters nz and n* according to formula No. 26, the resulting density of the polyhedron foam glass is
28)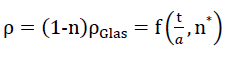
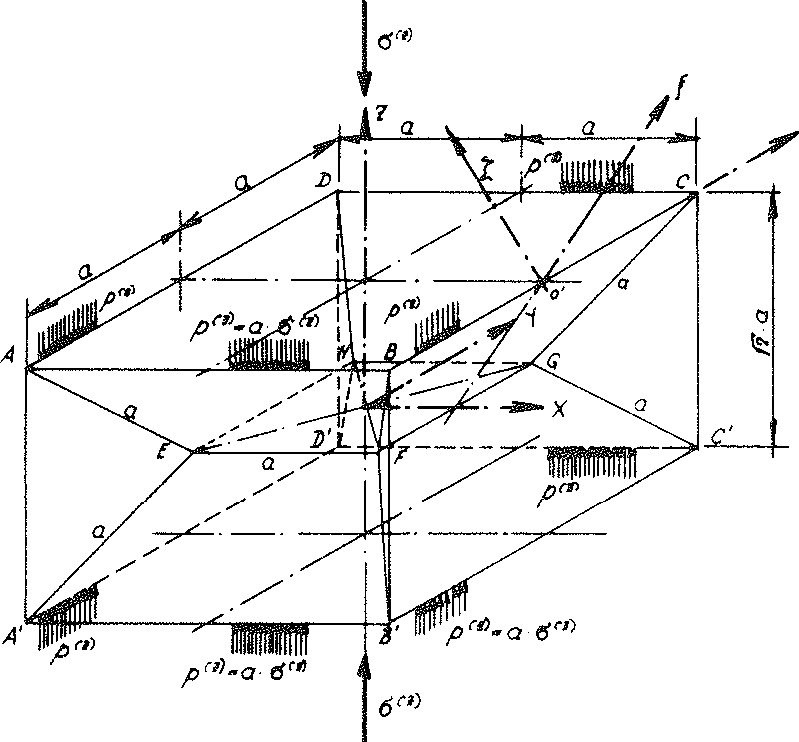
Fig. No. 18 the sub-unit loaded with the line loads ρ(z) from the external loading σ(z) of the “TOP” model foam glass
JEach sub-unit of the cell structure from the planar centre surfaces of the cell wall films of the “TOP” model foam glass unconstrained on all sides is equal. For this reason, any suitable coordinate system connected with a sub-unit can be considered to be at rest and therefore selected as a static reference system for the complete polyhedron foam glass body. As a result for further investigations the sub-unit shown in the Fig. No. 18 above is usedand the associated coordinate system x, y, z stipulated for the complete model foam glass body as a static reference system.
Layout and elevation of the cell structure of the model foam glass (Figs. No. 11 and 12) show, how edges of the sub-unit running parallel (z.B. 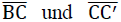 ) to the axes x, y, z of the static reference system each lie on one two-fold rotational axis of the complete model foam glass. Before during and after loading of the model foam glass with the external surface load σ(z) unconstrained in x-, y-, and z-direction, the symmetry properties of these rotational axes are retained and they stay straight.
The z - axis of the coordinate system x, y, z connected with the sub-unit remains a four-fold rotational axis of the “TOP” model foam glass before, during and after loading σ(z) For this reason the geometric boundary conditions for the imaginary sub-unit separated out from its cell structure only needs to be dealt with in detail using examples at its edges . Since each partial surface of the sub-unit of the model foam glass forms a centre surface of a planar cell wall film, the separation out from the cell structure of the model polyhedron foam glass equates to being cut out of a surface supporting structure consisting of planar plates (= material sub-unit). The boundary conditions for the moments and forces occurring at the cutting edges of this support structure can be found from the geometric conditions with the aid of plate or disc theory.
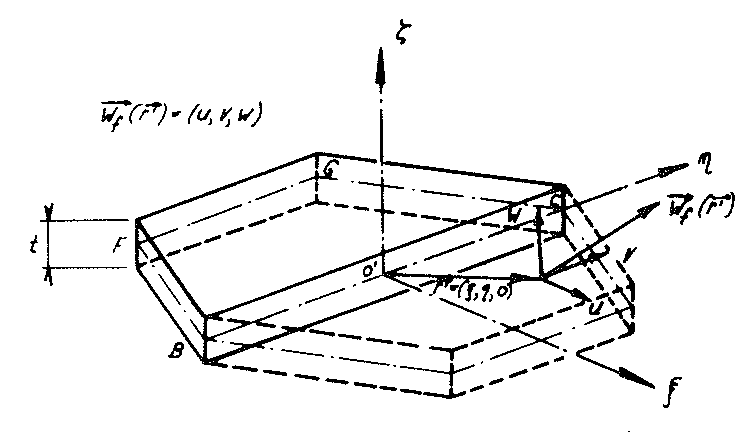
Fig. No. 19 Hexagon-shaped cell wall film of the “TOP” model foam glass
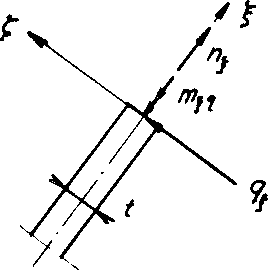
As Fig. No. 19 shows, the trapezoidal surface  (of thickness t) of the polyhedron model foam glass. In the Figs. No. 18, No. 19 and No. 20, the right-handed coordinate system 𝜉, η, ζ fixed to the plate under consideration (= cell wall film) is shown, whose origin lies at the centre point of the line BC.
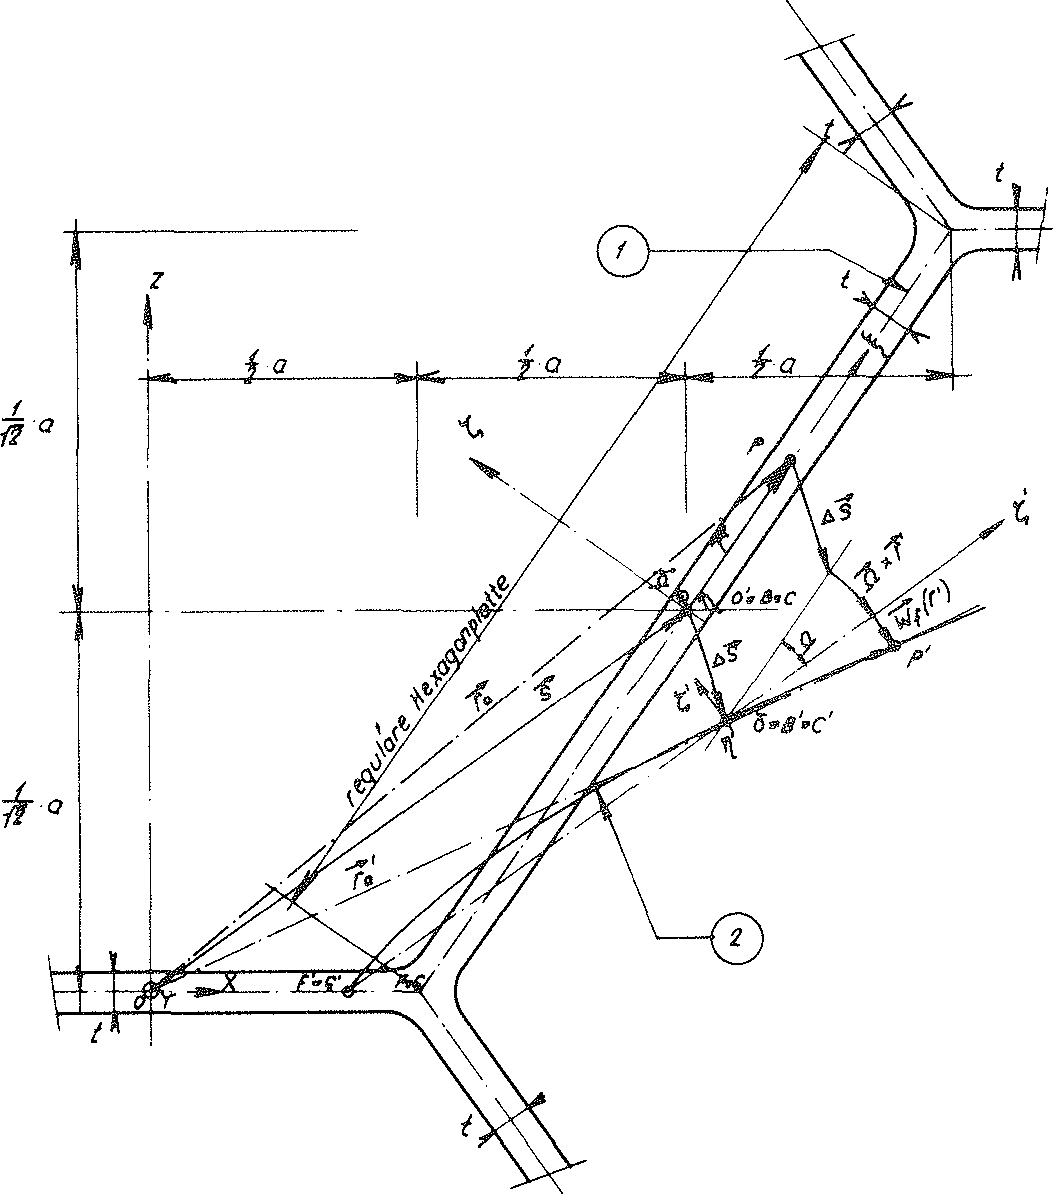
Fig. no. 20 Section of the material sub-unit of the “TOP” model foam glass with the xz - plane
- 1.Model foam glass loaded
- 2.Model foam glass unloaded
Fig. No. 20 shows the section of the hexagon plate of the “TOP” model foam glass under consideration with the xz - plane before, during and after loading with σ(z). As a result of this external loading, the hexagon plate undergoes rigid body motion and shape changes. As rigid body motion (see Fig. No. 20) it leads overall to a translation  and a rotation
  (the line of action of the vector vruns parallel to the η - axis). Here, each point P displaces the plate with the vector
  (for small assumed value of the rotation angle ) into the new position
29)
In reality the plate (cell wall film), assumed so far to be rigid, behaves in an ideal elastic manner. As an element of the “TOP” model foam glass it will deform in such a way under the external loading σ(z) that at all of its edges the geometric relationship (compatibility) remains valid with the neighbouring cell wall films (see Fig. No. 20). As a result of this fact, the displacement vector  (
( ) should be assigned to each point P of the plate. This can be interpreted as a relative displacement regarding the coordinate system ξ, η, ζ ihus each point P(
 ) dof the plate1) moves to the new final position.
30)
The axis of the coordinate system ξ, η, ζ is concurrent with the two-fold rotational axis defined by the two points B and C and has the same direction as the angle of rotation . As a result for all points P on the η - axis the vectors () and the vector product x  disappear in the above relationship. This means that
- 1)a planar surface beam, which is only loaded by in-plane forces and whose centre plane remains planar during the shape change is called disc. The same body is also described as a plate, if it is subjected to a load, which causes warping of the original planar surface. Planar surface beams, which are loaded as disc and plate at the same time are also described as plates.
all points P ( ) aon the line BC move translationally by
  s to the final position with the vector
31)
( || η - Achse).
The component notation of the relative displacement assigned for each point P ( =(ξ,η,ζ)) of the plate centre plane with respect to the system ξ, η, ζ (see Fig. No. 19) is
(=(ξ,η,o))=(u(ξ,η,o),ν(ξ,η,o),w(ξ,η,o))
The two components u and v describe the planar distortions of the plate centre plane (disc loading) and w the bending normal to it (plate loading) As a result of the two-fold nature of the η - axis of the system ξ, η, ζ for these displacements, the following symmetry conditions apply
32)
- (a) u(ξ,η,o)=−u(−ξ,η,o)
- (b) ν(ξ,η,o)=+ν(−ξ,η,o)
- (c) w(ξ,η,o)=−w(−ξ,η,o)
The bending deflections w (ξ, η, o)have very small absolute contributions in comparison to the plate thickness t.For this reason the distortions in the plate centre plane they cause can be neglected. This means that the planar stress condition of the original planar plate (membrane stress condition from disc effect) is not influenced by the lateral deflections w (ξ, η, o) . This however is equivalent to a decoupling of the mixed problem of plate- and disc-effect! Thus the boundary conditions for the membrane loading (disc) and the bending loading1) at the edge  of the material sub-unit can be formulated separately.
- 1)However only two boundary conditions can be fulfilled for each location of the plate edge.
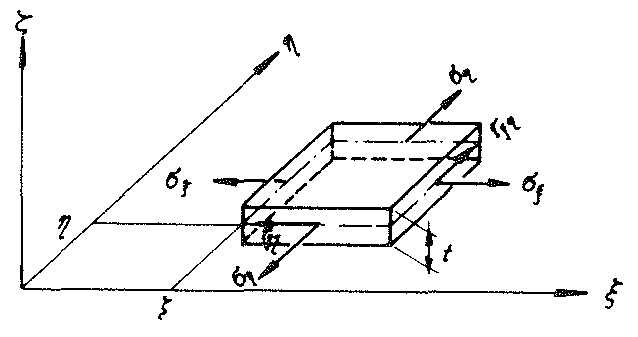
Fig. No. 21 Element dξ ⋅ dη⋅t of the hexagon plate of thickness t
- Plate stiffness:D =

- E: Modulus of elasticity, ν : Poisson’s ratio
Fig. No. 21 shows the element dξ ⋅ dη ⋅ t of the hexagon plate under consideration, whose centre surface is subject to p (ξ,η) bending w(ξ,η) as a result of the surface loading. These two values fulfil the known bi-harmonic plate equation (12)
33)
as well as the boundary conditions.
Since forces only act on the mobile edges of the plates considered, for all of their points the surface loads are p (ξ,η)=0. The plate equation thus simplifies to a homogeneous bi-harmonic equation
34)ΔΔw=0
The intersecting forces acting on the plate element dξ⋅dη⋅ton Fig. No. 21 and on the length unit of the cutting surface are
From formula No. 32 c, for ξ=0 the disappearance of the second order derivative of the bending surface w(ξ,η,o) can be inferred based on the variables ξ. Therefore the following applies
36) w(0,η,o)=0
The fact, that with the external loading σ(z) considered here the line on the η - axis  of the plate centre plane remains straight is manifested with the statement
37) w(0,η,o)=0
Is these last two conditions are put into the formulae No. 33, then the sectional moments (bending moments and torsional moments) acting on the unit length of the sectional surface ξ=0 of the trapezoidal plate  become
mξ(o,η) = mη(o,η) = 0,
mξη(o,η) ≠ 0 and the shear forces become
qξ(o,η) ≠ 0 as well as qη(o,η)=0 ;
i.e. as a result of bending, at the section ξ=0 of the plate, only shear forces qξ and torsional moments mξη act on the length unit of the cutting surface.
Further above it has been demonstrated , that as a result of the external loading σ(z) of the model foam glass the centre plane of the hexagonal plate under consideration (see Fig. No. 19) is subject not only to bending w(ξ,η) but also planar distortions (u(ξ,η),ν(ξ,η)).
Fig. No. 22
Fig. no. 22 shows an element dξ ⋅ dη ⋅ t of the hexagonal plate under consideration with the membrane stresses σξ,ση and τξη=τηξ
acting on it. These stresses must fulfil the equilibrium conditions
38)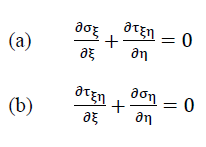
of the balanced stress state. They can be expressed with the function F (ξ, η) as follows:
39)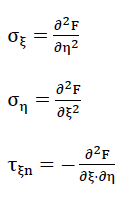
F(ξ,η), which is known as the so-called Airy’s stress function, must fulfil the disc equation
40)ΔΔF=0
and all boundary conditions of the problem.
The disc equation applies for all isotropic materials which obeys Hookes
Law. In this equation the equilibrium conditions (formulae no. 38), geometric conditions and stress strain equations are summarised in a differential equation
As a result of the symmetry conditions No. 32a and No. 32b, on the diagonals of the “plate centre plane” the angle changes also disappear
41)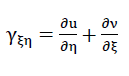
between the line elements dξ and dη ; i.e γξη=0 applies.
For a plate of ideal elastic base material the known relationship
42)𝜏𝜉𝜂=𝐺⋅𝛾𝜉𝜂
exists between the shear stresses τξη and the angle changes γξη mit G=  As a result, for all points of the cutting surface ξ=0 the shear stresses τξη(o,η)=0 apply.
By putting these in the equilibrium condition No. 38a, it can be proved that at all points on the cutting surface ξ = 0 only the normal stresses σξ(o,η)=f(η) and ση(o,η) = constant can occur.
AA priori it can be determined that variable normal forces variable shear forces nξ=σξ(o,η,ζ)⋅t and variable torsional moments qξ=qξ(o,η) uact on the length unit of the edge of the material sub-unit! mξη=mξη(o,η)
Thus the line acan be considered to be a jointed line which remains straight!
Since the z - axis of the sub-unit under consideration coincides with a four-fold rotational axis of the “TOP” model foam glass, and all sub-units are equal, the last statement can be transferred to all its joint lines running parallel to the x and y axes of the stationary reference system x, y, z.
As the layout and elevation on Fig. No. 11 and 12 show, the planar triangle  of the sub-unit lies in one plane of symmetry and its side
 on a two-fold rotational axis of the model foam glass “TOP”. Thus the triangle forms half of the centre plane of a quadratic plate of the material sub-unit of thickness t (see Fig. No. 23).
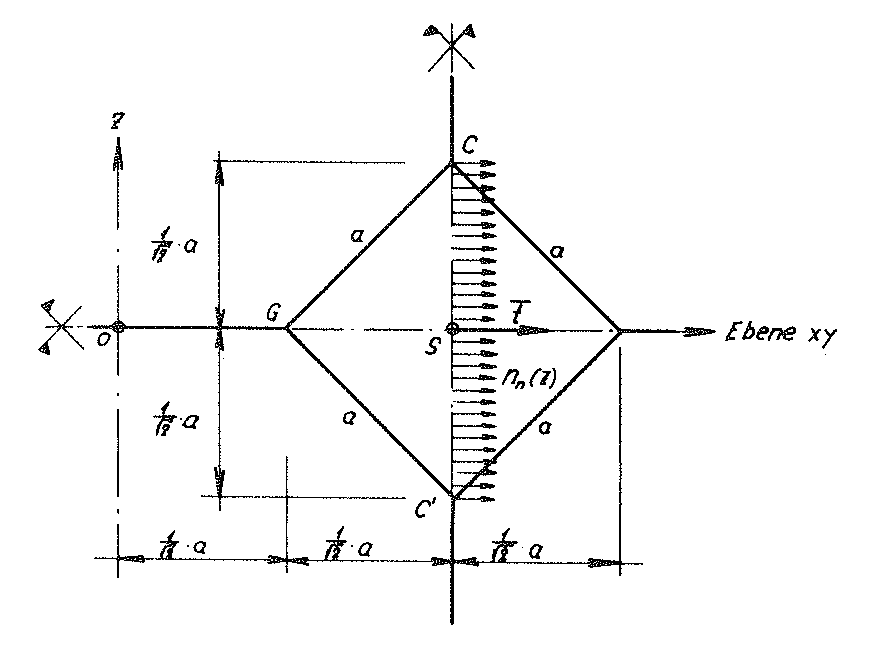
Fig. No. 23 Section of the sub-unit of the “TOP” model foam glass with its plane of symmetry defined by the points
C, G and C; S: centre of gravity
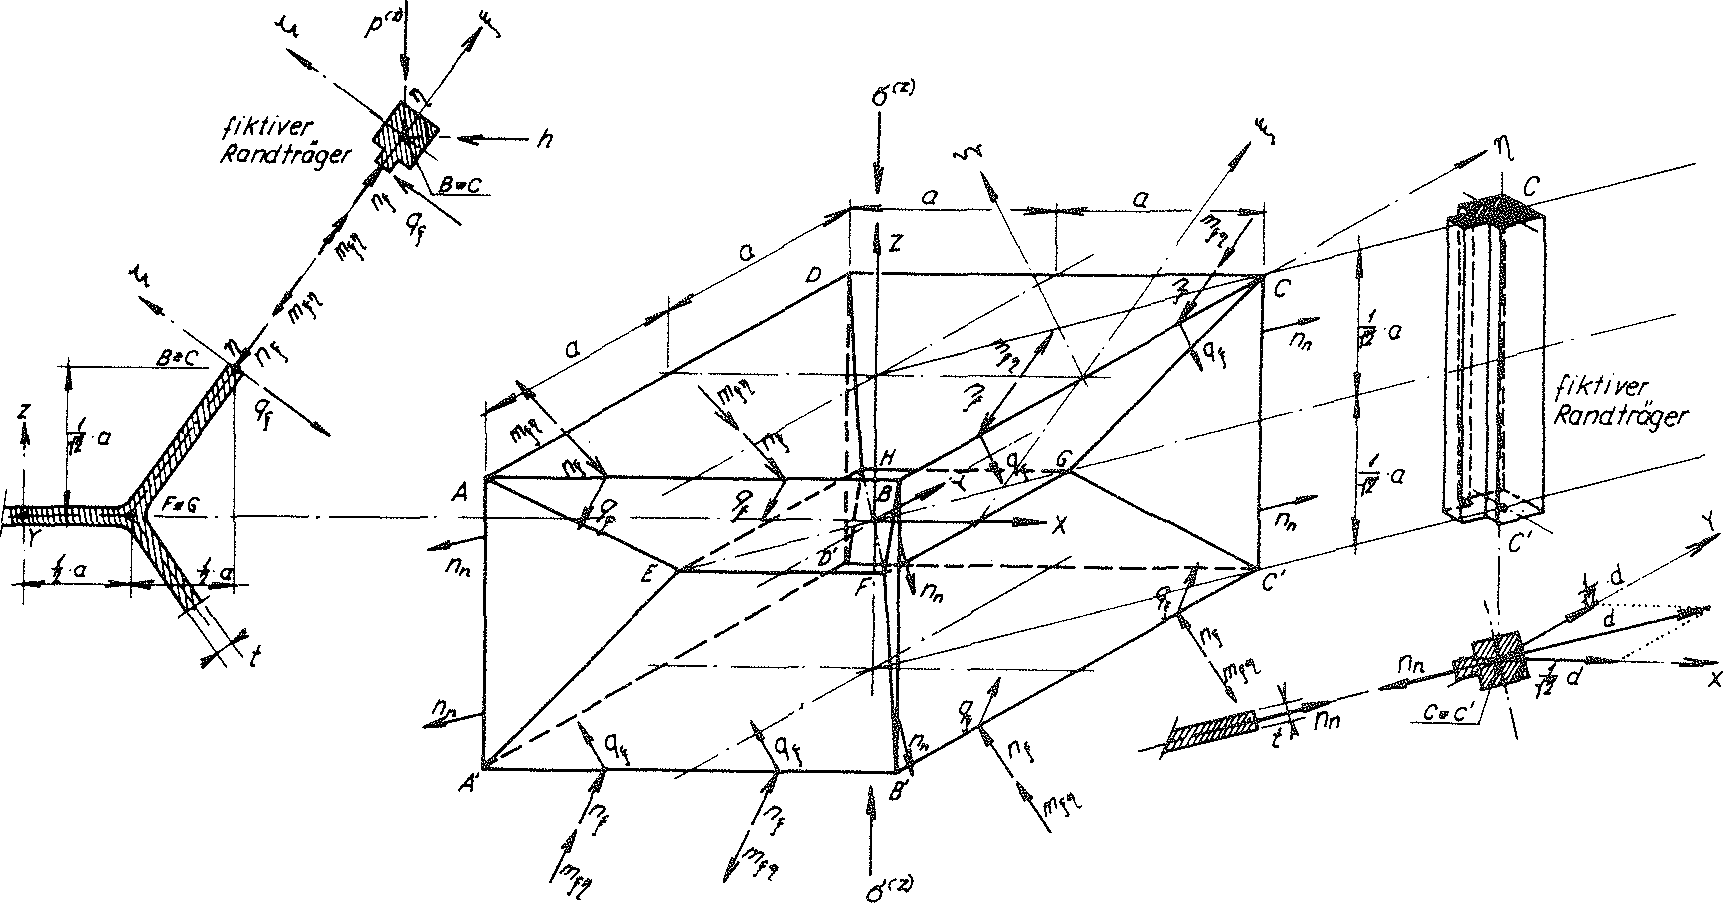
Fig. No. 24 The intersecting forces acting on the material sub-unit of the “TOP” model foam glass under the external loading σ(z)
The above symmetry properties of the quadratic plate under consideration are not lost during addition of the load σ(z) dto the model foam glass. For this reason, its centre surface defined by the triangle CC’G remains planar as part of the above plane of symmetry. . It is only subjected to a rigid body translation  = (tx,ty=tx,o) 1) and deformations symmetrical to its centre plane.
Since the diagonals of the centre surface of the quadratic plate (disc) under consideration lies on a two-fold rotational axis, analogously to the edge of the material sub-unit (edge of the hexagon plate) it can be proved that it can only be subject to variable normal forces nn=nn(z) with reference to its length unit with lines of action in the plate centre plane.
The z - axis of the sub-unit remains a four-fold rotational axis of the “TOP” model foam glass before, during and after loading with σ(z) . For this reason it is possible to conclude, that at all vertical edges of the material sub-unit under external loading σ(z) only variable normal forces nn(z) with lines of action perpendicular to the z - axis can act.
Fig. No. 24 shows a material sub-unit of the “TOP” model foam glass under external loading σ(z) . Equally the intersecting forces nξ,qξ,mξη and nn acting on the length unit of their edges were entered there.
We provide all edges of this material sub-unit with fictitious beams, which are not permitted to create any additional constraints (see Fig. no. 24)! Such a beam has a high bending stiffness (EJξ=EJζ=∞), low torsional stiffness (GJP=0) and low tensile stiffness (EF=0). As a result of these special elastic properties of the edge beam, the loads mξη,qξ,nξ and nn aat the edge of the unreinforced material sub-unit can be replaced with the constant line loads p(z), h and  acting at the reinforced material sub-unit (see Fig. No. 24a). Here the geometric boundary conditions according to the formulae no. 32 are maintained.
- 1)The line of action of the vector coincides with that of the straight line defined by points O and S.
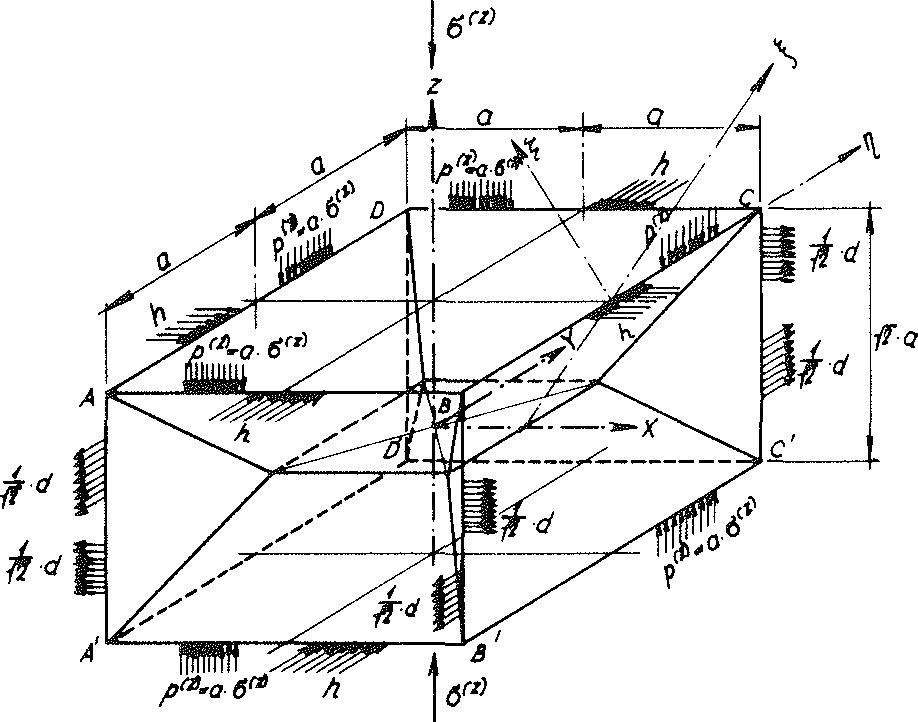
Fig. No. 24a The material sub-unit of the “TOP” model foam glass loaded with the line loads p(z) from the external loading σ(z)
On Fig. No. 24a, all line loads acting on the edges of the reinforced material sub-unit in the direction of the coordinate axes x, y, z have been entered!
Since the foam glass is only loaded by the external surface load σ(z) the sum of all forces acting at the sections must disappear x=±a (ΣXi=o). The same applies analogously for the sections y=±a. Then becomes
431))
In the planes x = ± a and y = ± a of the reinforced material sub-unit, the fictitious edge beams form frames with high bending stiffness. For this reason it can be concluded that the value exerts no influence on the loading pattern
- 1)
of the material sub-unit “reinforced” in this way.Thus for further consideration it can be set to zero. Then only vertical line loads acting on the edges of the reinforced material sub-unit remain (also see Fig. no. 18).
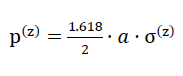
44)p(z) = а ⋅ σ(z)
According to the hypothesis in section 1.3.1 of this chapter then σ(z) the compressive strength  or tensile strength
  in z direction of the space can be equated, if the maximum main tensile stress at any location in the internal surfaces of the polyhedron cells of the “TOP” model foam glass reach the fracture strength σB(n∗) of the spherical foam glass plates of the cell walls classed as a continuum.
DSince glass, and therefore spherical foam glass films of the polyhedron foam glass made from this base material demonstrate a brittle fracture behaviour (see section 1.1) and therefore no reduction of local stress peaks can take place due to plastification of the base material as with ductile materials, it is important to understand the stress conditions on the surfaces of the cell wall films (see hypothesis in section 1.3.1) as exactly as possible to determine the strengths and
For this reason, for the required stress analysis the reinforced material sub-unit of the model foam glass using various planes of symmetry was limited to a sixteenth, as shown in Fig. No. 25. The material sub-unit thus reduced was then divided into 340 finite elements for the loading σ(z)
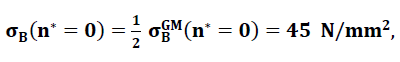
Since according to equation NO. 28 in section No. 1.3.2.1 the density of the “TOP” model foam glass in addition to the density ρGlas of its glass base material only depends on the ratio  and the porosity n* of the spherical foam glass films, for the determination of the fracture strengths and with the porosity n* set to zero only the ratio varies in each case (i.e. actually only the density ρ). The corresponding values and for other values n∗≠0 of could be recalculated proportionally as a result of the surface hypothesis. The tensile strengths of the spherical foam glass cell wall films treated as a continuum as per section No. 1.3.1 were assumed as
45)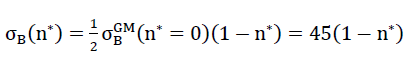
In the table on page 52, the results for the strength values (n∗,ρ) and (n∗,ρ) determined in this way were summarised and represented graphically in Figs. No. 26 and 27.
If the tensile strength  (n∗=0) of the glass base material of the cell wall films does not have the assumed value of 90 N ⁄ mm2, for the compressive strengths and tensile strengths in z spatial direction for the calculation of the table values and for creating the diagrams, but instead another value
  (n∗=0),then the corresponding table values and the ordinates in the associated diagrams must only be multiplied with the correction factor
  .
.
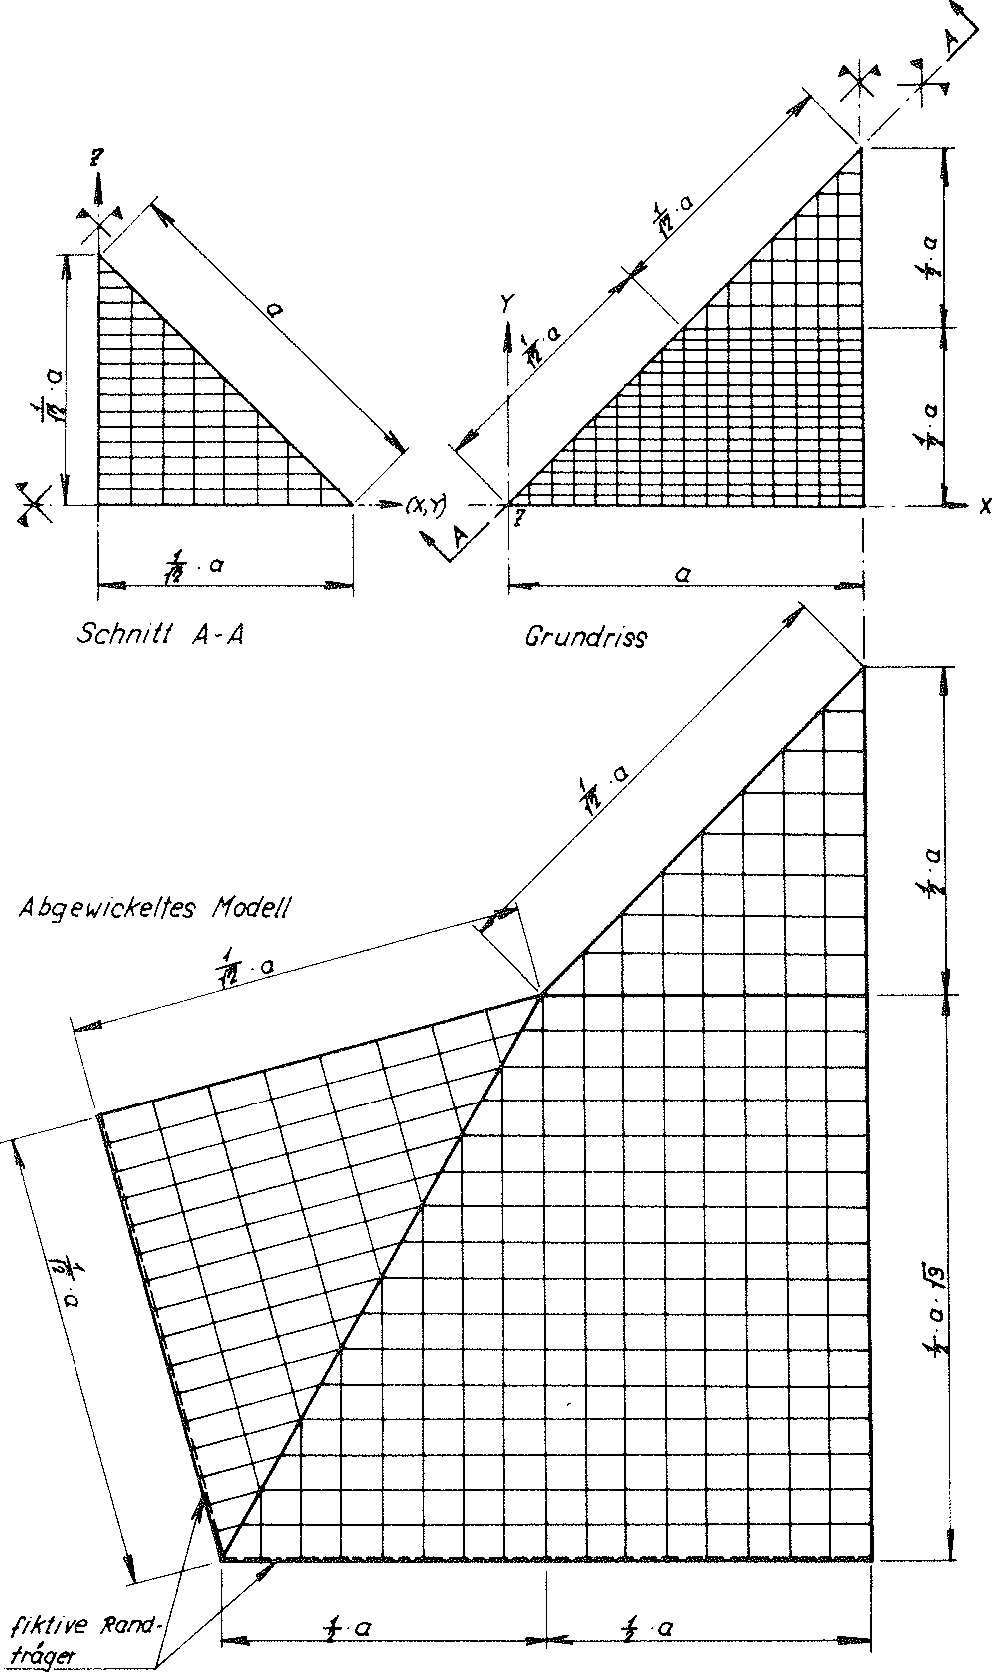
Fig. No. 25 Division of the reinforced material sub-unit of the “TOP” model foam glass reduced using the symmetry into 340 finite elements.
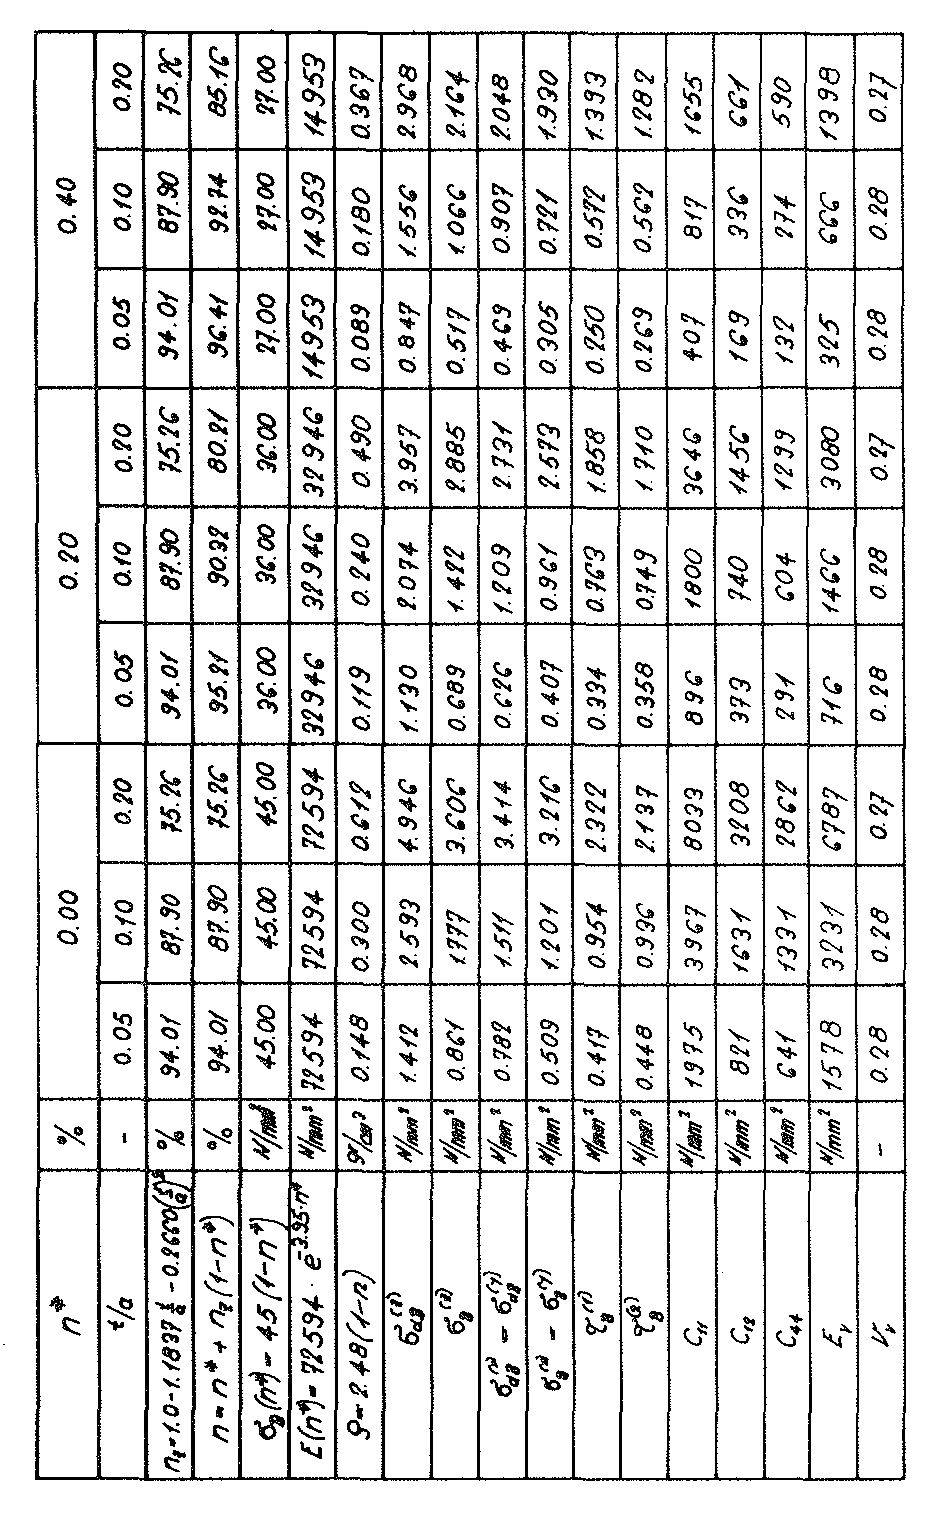
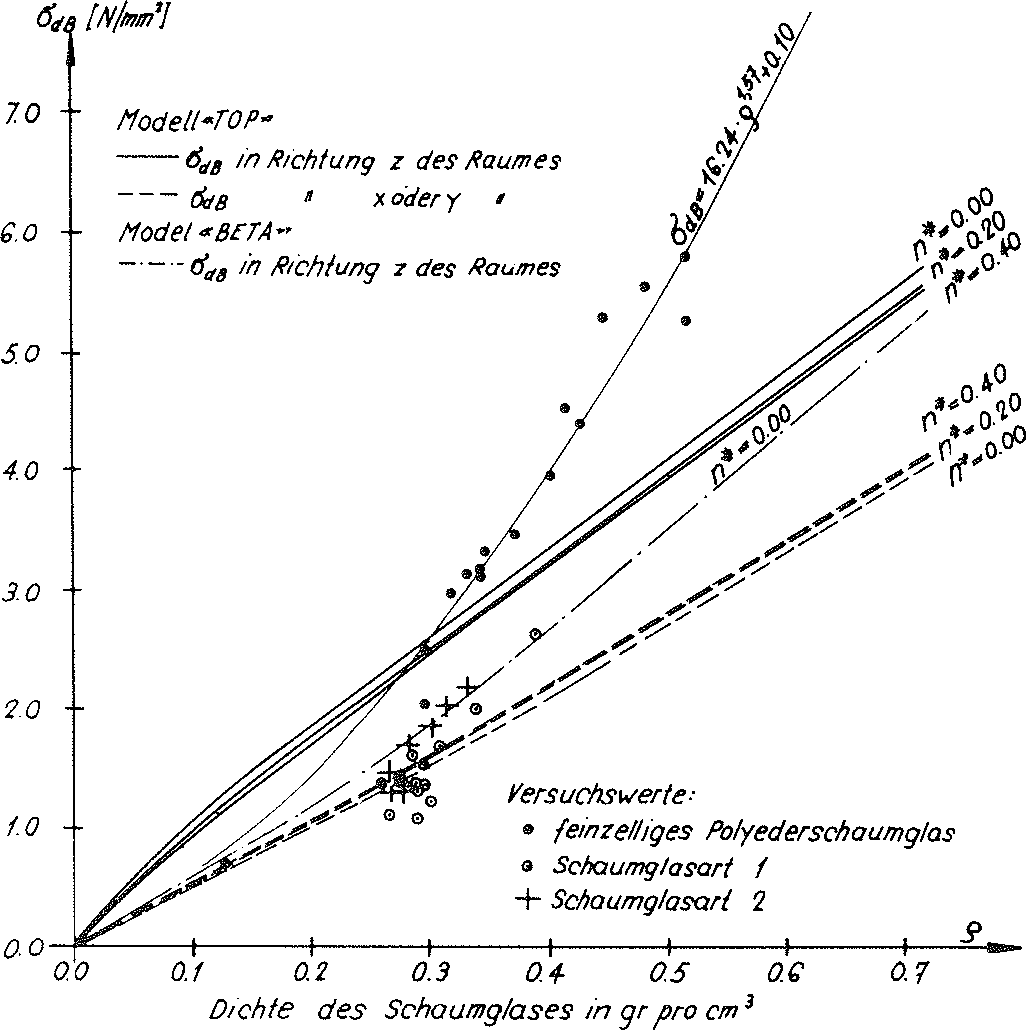
Fig. no. 26 The compressive strengths of the “TOP” model foam glass
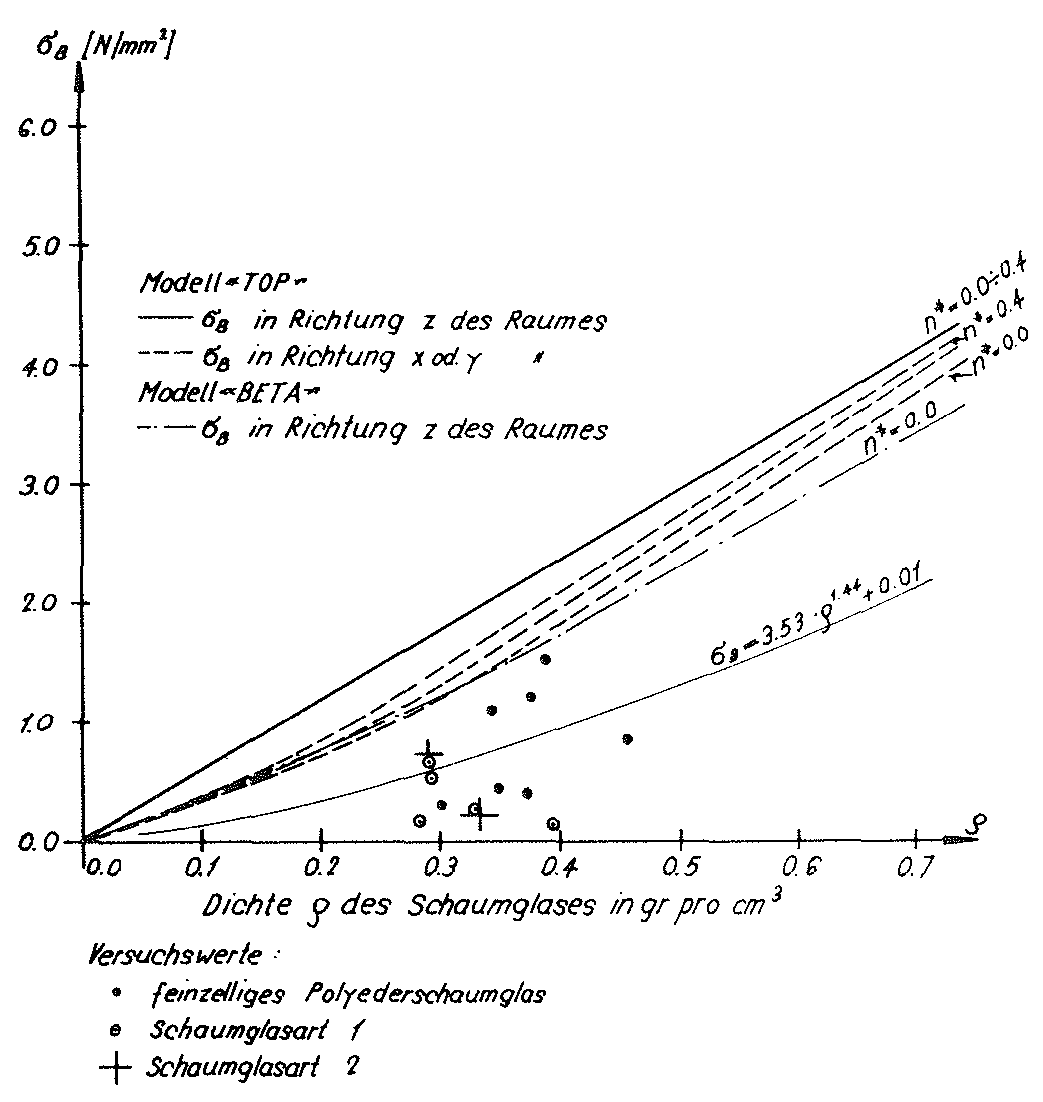
Fig. no. 27 The tensile strengths of the “TOP” model foam glass
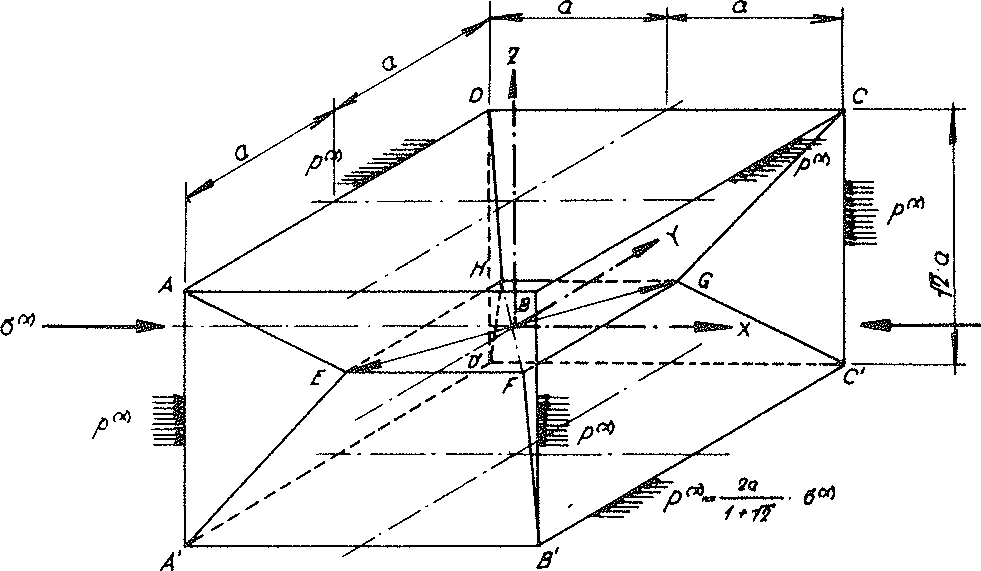
Fig. no. 28 The sub-unit of the “TOP” model foam glass loaded with the line load p(x) from the external loading σ(x)
Here the “TOP” model foam glass is loaded with a surface load σ(x) in x direction of the space unconstrained in y- and z- direction with respect to the cartesian coordinate system xyz entered in the layout and elevation Fig. No. 11. With this type of loading, all edges of the sub-unit represented in the Fig. No. 28 lie on the two-fold rotational axes before, during and after loading. This is - analogous to the statements in the previous section - equivalent to considering all edge lines of our sub-unit as part of a jointed line. For this reason, all edges of the material sub-unit can be reinforced with the same fictitious beams as with the loading case σ(z).
To determine the stresses in the “reinforced” material sub-units, it is then only necessary to take into account the horizontal constant line loads
acting at their edges
46)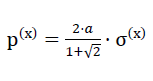
(see fig. No. 28)..
According to the hypothesis in section No. 1.3.1 of this chapter σ(x) can then be equated to the compressive strength  or tensile strength
  in x direction of the space, if the maximum main tensile stresses at any point in the inner surfaces of the polyhedron cells of the “TOP” model foam glass reaches the fracture strength σB(n∗) of the plates of the cell walls which have been classed as a continuum.
Since due to reasons of symmetry the directions x and y of the space are equal, the statement above also applies for a laterally unconstrained surface load σ(y) in direction y of the space. This means the equivalences
=
for the compressive strengths
and
 =
=
for the tensile strengths of the “TOP” model foam glass.
Since glass, and therefore the spherical foam glasses of the polyhedron foam glass made of this base material exhibit a brittle fracture behaviour (see section No. 1.1), the stress conditions on the surfaces of the cell wall films must be known exactly to determine the strengths and .
For this reason for the required stress analysis the reinforced material sub-unit was limited by using the varies planes of symmetry to an eighth, as shown in Fig. No. 29. The sub-unit reduced in this was then divided into 584 finite elements for the loading σ(x)
Since according to the equation No. 28 in section No. 1.3.2.1 the density ρ the “TOP” model foam glass as well as the density ρGlas of its base material only depend on the relationship  and on the porosity n* of the spherical glass foam films alone, for the determination of
  = and
= and  = with the porosity n* set to zero in each case only the relationship was varied, i.e. in effect only the density ρ .
The corresponding strengths = and = for other values n∗≠0 could be converted proportionally as a result of the surface hypothesis. The tensile strengths of the spherical foam glass cell wall films treated as a continuum as per section No. 1.3.1 were assumed as
47)
In the table on page 52, the results for the strength values = and = determined in this way were summarised and represented graphically in the Figs. No. 26 and 27.
If the tensile strength (n∗=0) of the glass base material of the cell wall films does not have the assumed value of 90 N/mm2, for the compressive strengths and tensile strengths in y or x spatial direction for the calculation of the table values and for creating the diagrams, but instead another value (n∗=0),then the corresponding table values and the ordinates in the associated diagrams must only be multiplied with the correction factor .
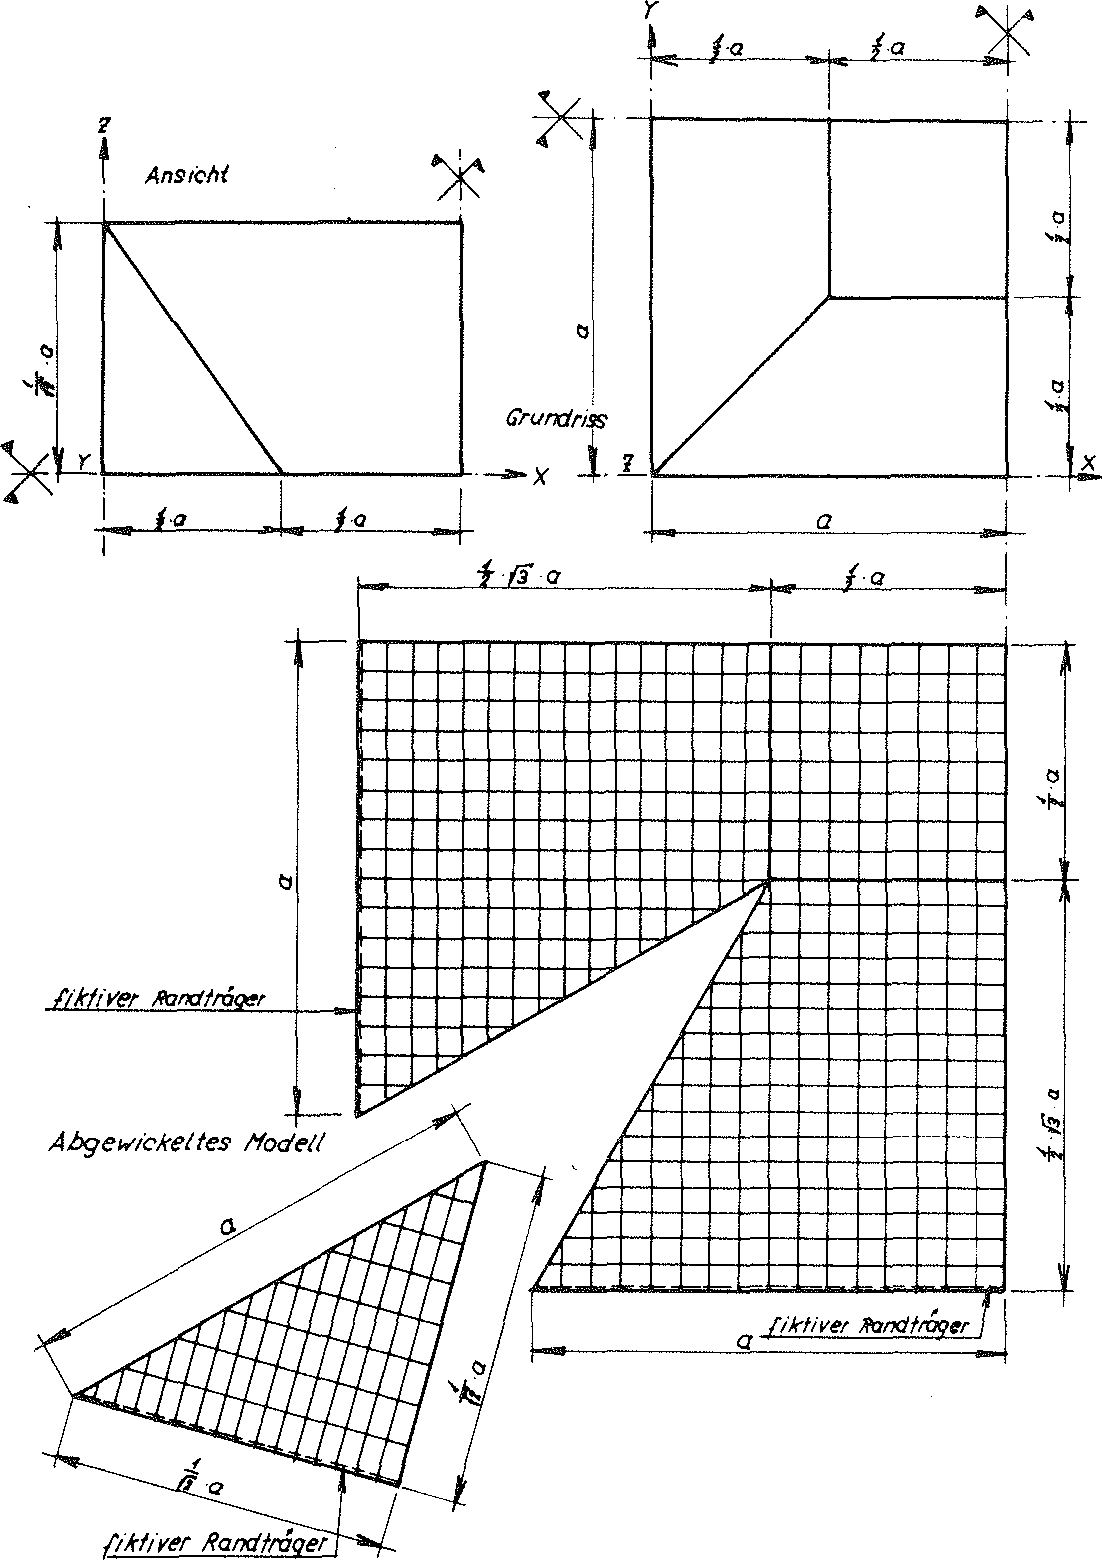
Fig. No. 29 Division of the reinforced material sub-unit of the “TOP” model foam glass reduced using the symmetry into 584 finite elements.
For any given section E𝚒 through the “TOP”model foam glass unconstrained on all sides an external loading configuration can be found which causes a pure shear loading τ𝚒 within it, according to the surface hypothesis in section no. 1.3.1 of this chapter τ𝚒 can then be equated to the shear strength τB𝚒 if the maximum main tensile stress at any of the points within the internal surfaces of the polyhedron cells of the model foam glass reaches the tensile strength σB(n∗) of the spherical glass foam plates of the cell walls classed as a continuum. Since an unlimited number of positions of the cutting sections through the “TOP” model foam glass exist, the smallest possible value τB𝚒 should be sought. This should then be defined as the shear strength of the model foam glass!
Only a rough estimate of the shear strengths should be made here! For this reason we will limit ourselves to the biaxial external loads σ(x)und σ(z)=−σ(x). These can be classed as main stresses and have been - as Fig. no. 30 shows - related to the - and - axis of the sub-unit of the model foam glass.
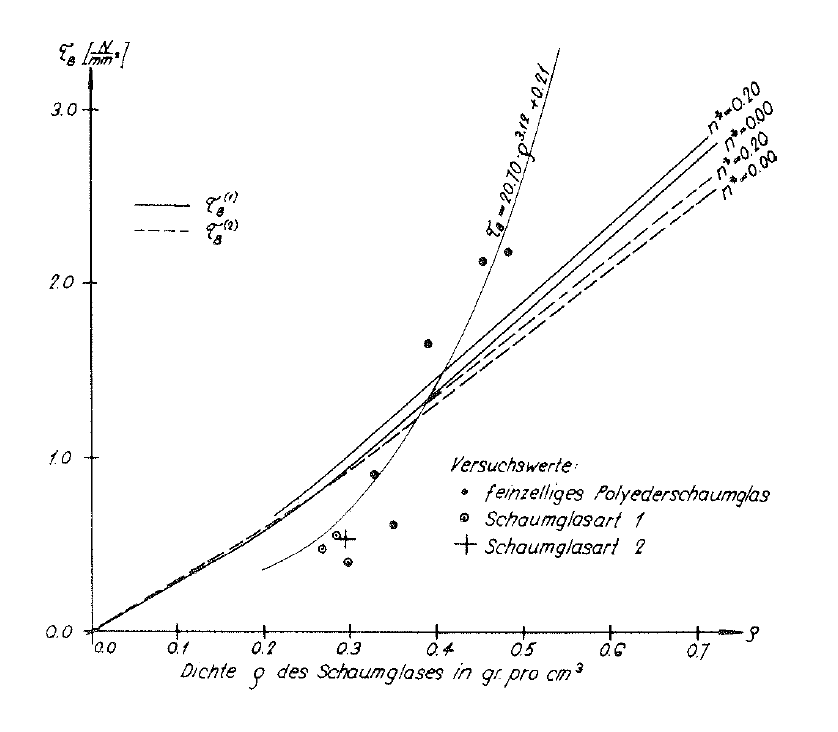
Fig. No. 31 The shear strengths of the “TOP” model foam glass.
The centre surfaces of the cell wall films of the “TOP” model foam glass consist of the surfaces of its periodically arranged elementary polyhedrons. Since the integral elastic behaviour of the “TOP” model foam glass is only determined by the behaviour of the individual congruent material base polyhedra which are compatible with eachother, these material elementary polyhedra - independent of their internal structure - can be handled similarly to single crystals in crystal physics.
Due to the symmetry considerations in section No. 1.3.2.1 in the “TOP” model foam glass, the same mechanical behaviour can be expected in parallel directions. For this reason, the “TOP” model foam glass can be described as an homogeneous anisotropic body. These occur in nature as crystals.
How is it possible to draw conclusions regarding its elastic behaviour from the symmetry properties of the “TOP” model polyhedron foam glass?
An answer to this question is provided by the Neumann Principle (13), which was actually created only for crystals.
This states: “The symmetry elements of any physical property of a crystal must include the symmetry elements of the point group (= crystal class) of the crystal."
If the relationship between two physical properties of a body in the direction of a fixed axis remains unchanged after executing a certain symmetrical operation, then we say that the value in question possesses this symmetry element.
With the “TOP” model foam glass, the symmetry elements of the elastic properties contain the symmetry elements of the m 3 m point group of the cubic crystal system.
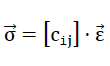
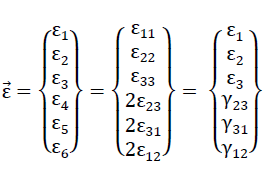
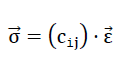
With reference to the right-hand Cartesian coordinate system (x1,x2,x3) in fig. no. 13, in matrix notation, the following relationship exists between the stress tensor 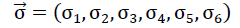 written as a vector and the vector-written distortion tensor
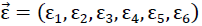
49).
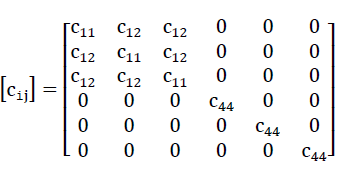
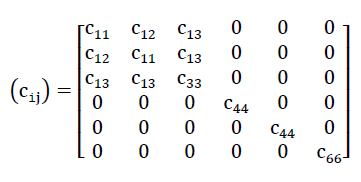
Here the matrix of the moduli of elasticity c𝚒j taking into account the point group m 3 m (crystal class) of our “TOP” model foam glass is
50).
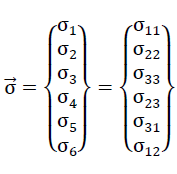
The components of the stress vector  and distortion vector
  are converted in the following equivalences:
51).
and
52).
The components σij of the vector were entered into the volume element of Fig. no. 32, which for equilibrium reasons with the absence of body rotational moments gives
53).σij = σji
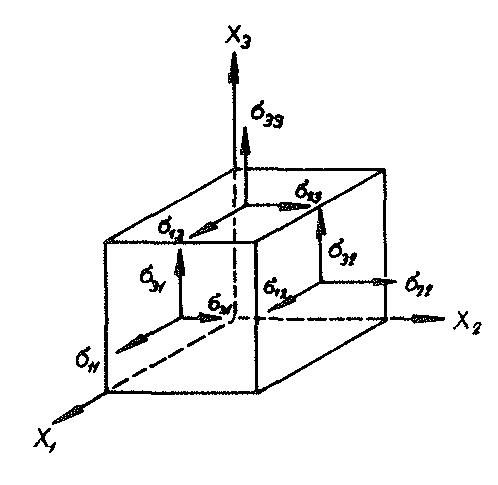
Fig. No. 32 Volume element of the “TOP” model foam glass treated as a continuum
The distortion components εij are determined using the equations
54).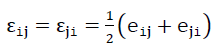
and
55). .
.
- 1)eij mean both components of a tensor [eij] 2. Level, which can be separated as follows into the symmetrical distortion tensor [εij] and into the antimetric tensor
 , which means a rigid body rotation:
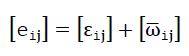
here eij means the differential of the displacement ui=f (x1,x2,x3) of a point in direction Xi to the coordinate Xj.
The values for the moduli of elasticity c11,c12 and c44 can - as performed later - be determined on the sub-unit defined above using the relationship according to equation No. 49 numerically for different conditions with n* = 0.
From an elastic point of view, real foam glasses behave isotropically; i.e. they possess a modulus of elasticity E and a Poisson’s ratio ν.
Based on the moduli of elasticity cij j of the homogeneous - anisotropic “TOP” model foam glass, how is it possible to derive the elasticity coefficients E and v of the quasi-isotropic polyhedron foam glass?
An answer to this question is provided by a process suggested by Voigt in 1928 to find the moduli of elasticity and the Poisson’s ratios of a polycrystalline aggregate from the moduli of elasticity cij of a single crystal (14).
He averaged the relationship between stress and given strain. This is conditional on the strain state running uniformly through the crystal aggregate.
A priori a given material elementary polyhedron of our polyhedron foam glass can be treated as a single crystal.
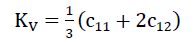
From the value c11,c12 and c44 of the “TOP” model foam glass we receive with
56)
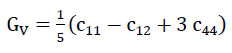
and
57)
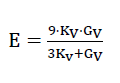
For the quasi-isotropic polyhedron foam glass the modulus of elasticity of
58)
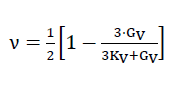
and the Poisson’s ratio
59)
At the same time as determining the fracture strengths in direction z or or of the space, for different loading directions the relationships between loading and deformation of the cuboid formed out of the perimeter of the sub-unit can be determined and thus the moduli of elasticity of the “TOP” model foam glass c11,c12 and c44 can be found for different values in each case with the porosity n∗set to zero. For other values of porosity n*, kthe associated values cij can be recalculated proportionally. The moduli of elasticity and the Poisson’s ratio of the spherical foam glass cell wall films which are treated as a continuum here were assumed according to section No. 1.3.1 at
and
ν(n∗)=ν(n∗=0)=0.21.
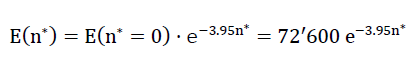
These values c11,c12 and c44 dof the homogeneous anisotropic “TOP” model foam glass and the moduli of elasticity and Poisson’s ratios ν determined according to Voigt for the quasi-isotropic polyhedron foam glass were also entered in the table on page 52. The relationships between the density ρ of the quasi-isotropic polyhedron foam glass and its moduli of elasticity E and Poisson’s ratios v were represented graphically in the Figs. no. 33 and 34.
If the modulus of elasticity E(n∗=0) of the cell wall film glass base material does not have the assumed value of 72,600 N/mm2 assumed here for the calculation of the table valuesc11,c12,c44,EV and νV and plotting of the diagrams for the moduli of elasticity EV and Poisson’s ratios νV but instead has another value E̅(n∗=0) then the corresponding table values and the associated diagrams only need to be multiplied with the correction factor  .
.
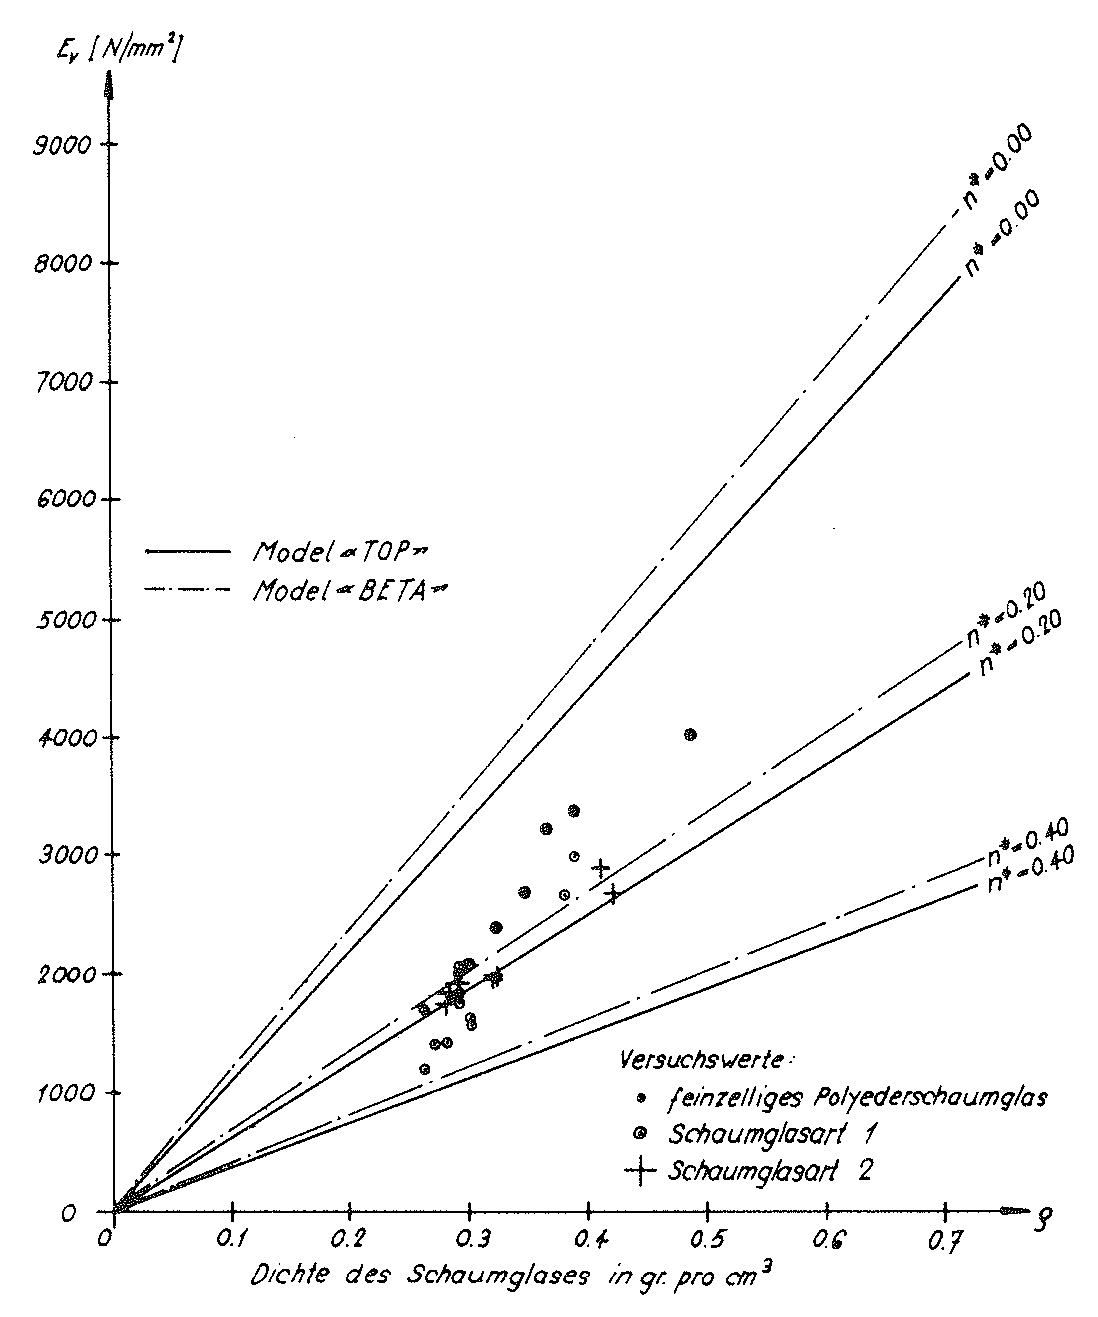
Fig. No. 33. The modulus of elasticity of the “TOP” model foam glass
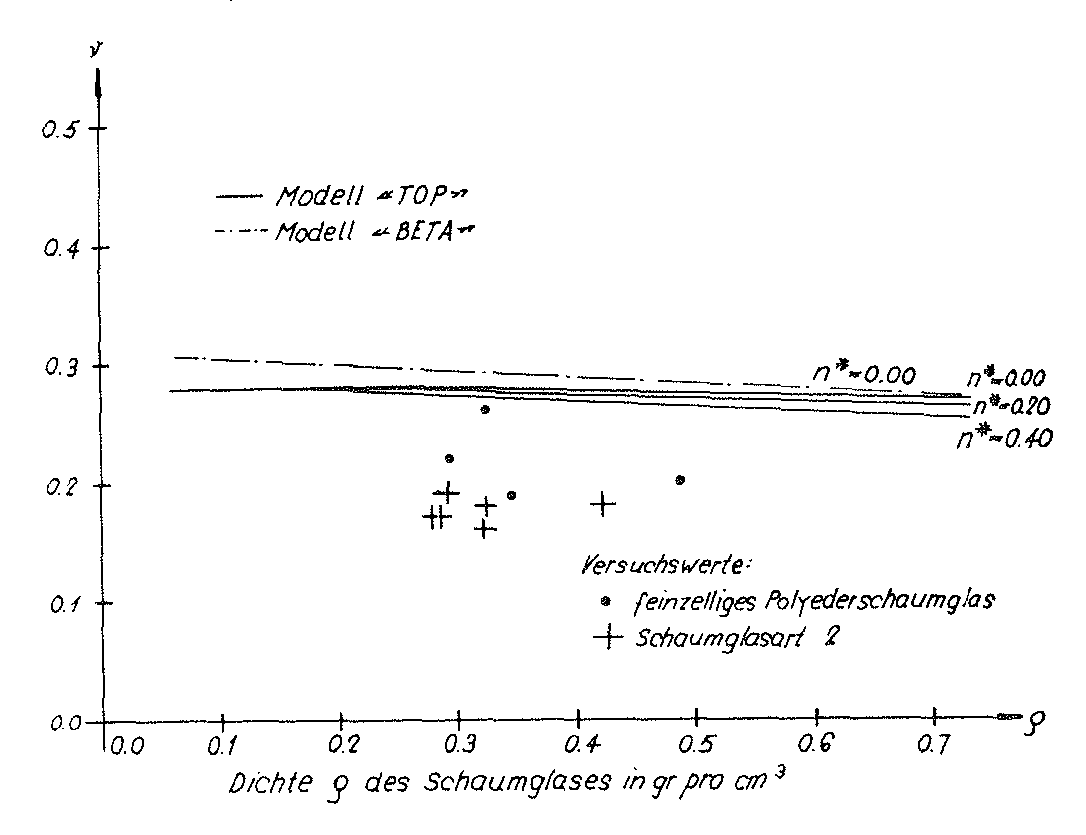
Bild Nr. 34. The Poisson’s ratio of the “TOP” model foam glass
In section No. 1.4.2 of chapter A an ideal foam glass was mentioned, whose cell structure is formed from many congruent β-tetradecahedrons as base polyhedron! The percentage distribution of the four-, five- and six-pointed partial surfaces of its cell structure roughly correspond with observations in nature.
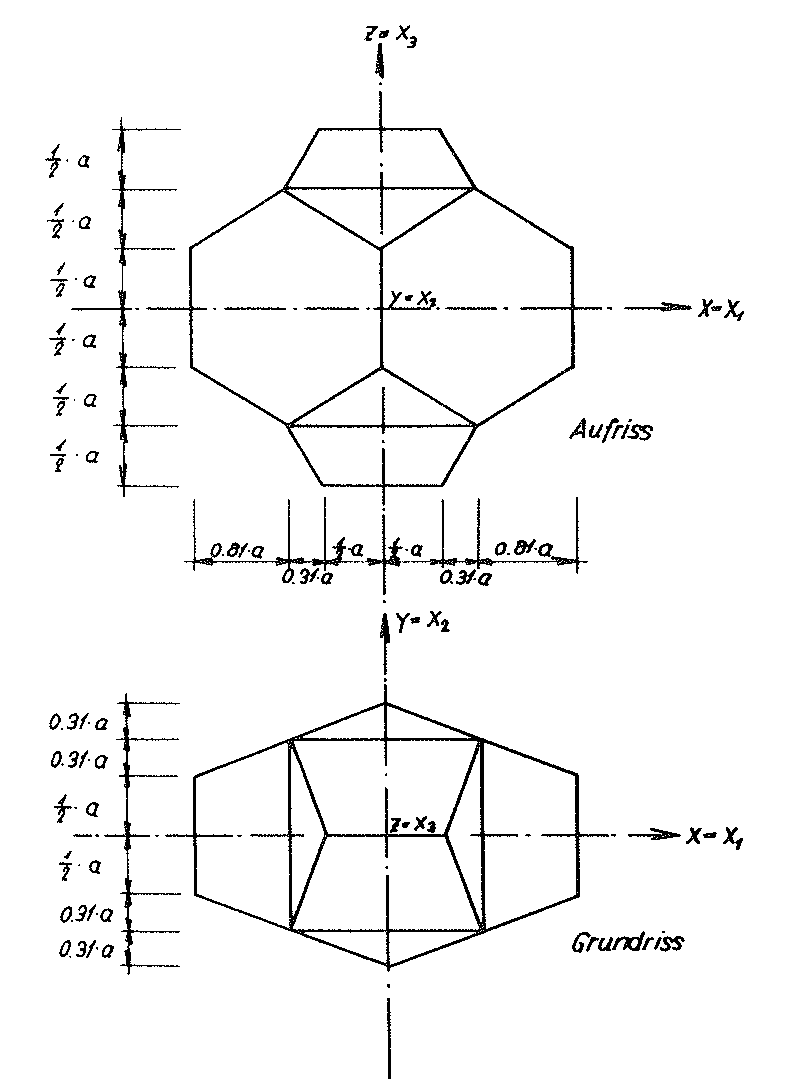
Fig. No. 35. Base polyhedron of the “BETA” model foam glass
The β -Ttetradecahedron in Fig. No. 5c can be “deformed” in such a way that all curved “edges” become straight and all curved surfaces
(minimum surfaces) become planar. Fig. No. 35 shows the polyhedron achieved in this manner. It has 22 surfaces, 24 corners and 44 edges, and will henceforth be named β - hedron.
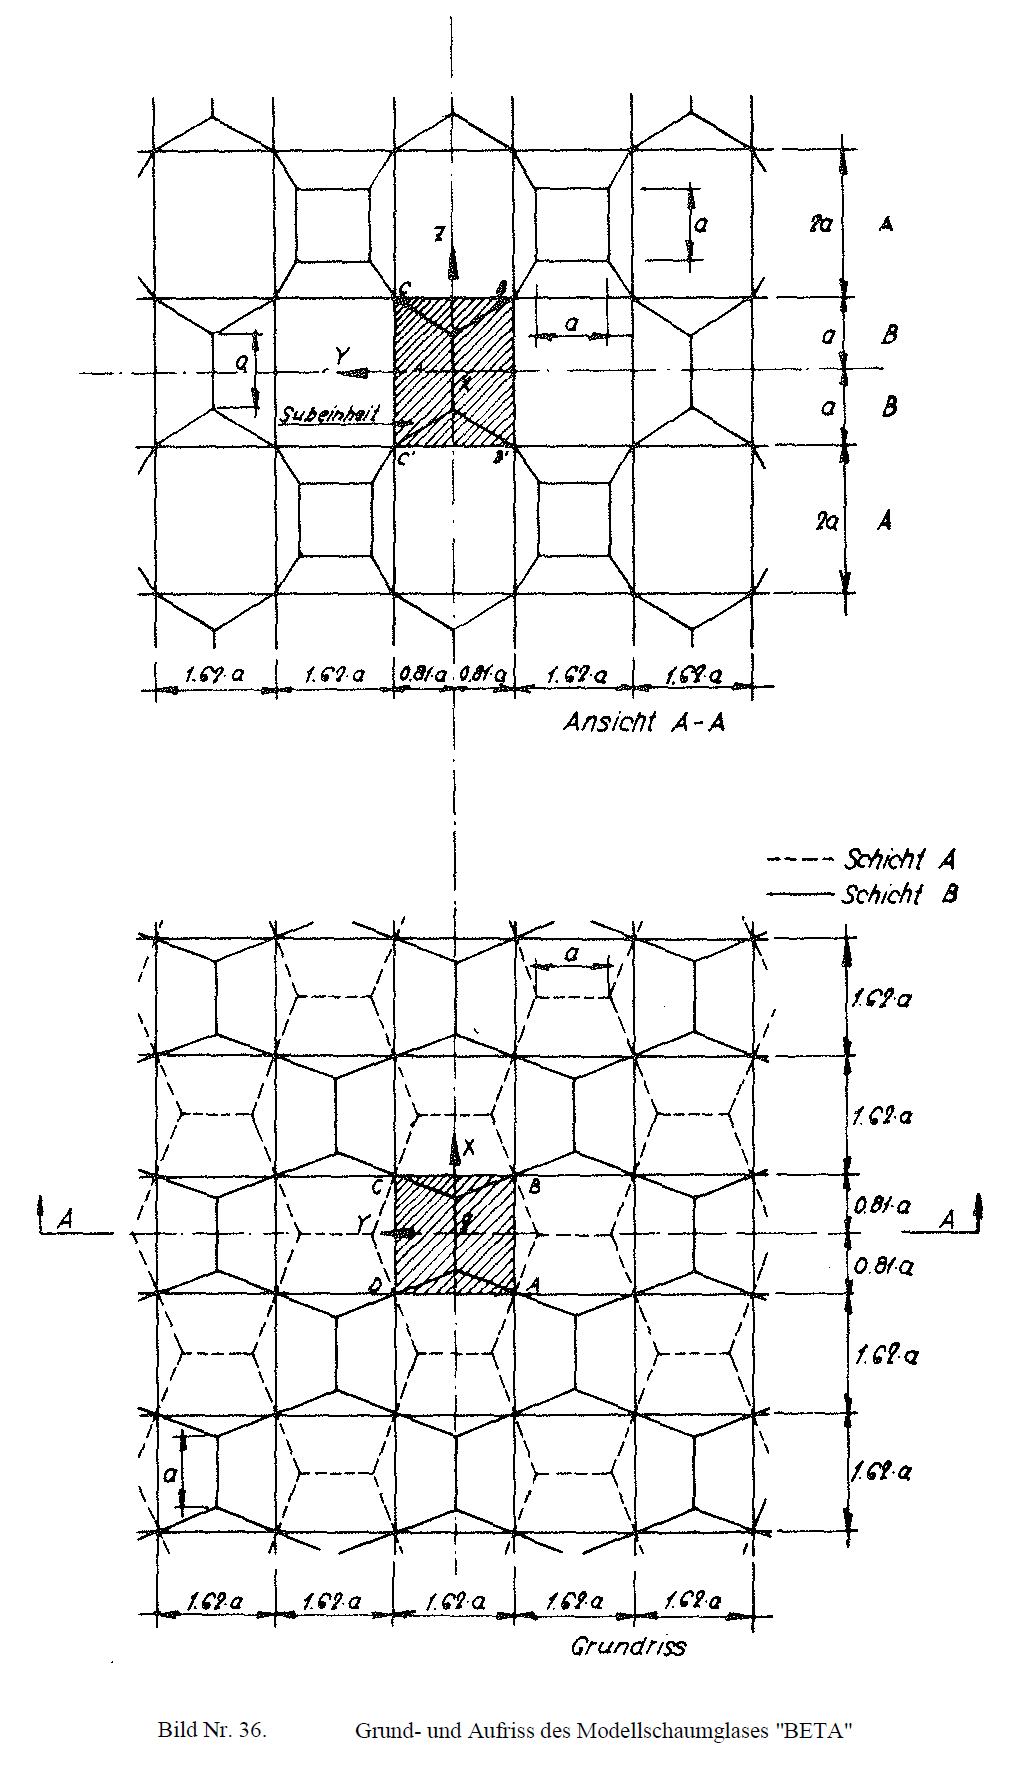
Its dimensions were chosen such that it can develop as an elementary polyhedron of the space-filling cell structure of a model polyhedron foam glass. Fig. No. 36 shows the layout and elevation of the “BETA” model foam glass produced in this way. The β - hedron has the following symmetry elements:
- 1)three two-fold rotational axes which coincide with the coordinate axes x, y and z;
- 2)the three planes of symmetry xy, xz and yz; defined by the coordinates x, y and z
- 3)a centre of symmetry coincident with the centre of gravity of the polyhedron.
These symmetry elements form a point group (crystal class), which can be described as mmm or 2/mm with the internationally recognised symbols. It is assigned to the orthorhombic crystal system and of course also applies for the cell structure of the “BETA” model foam glass which is unconstrained on all sides.
As with the “TOP” model foam glass, here the plateau edges (see fig. No. 14) and the fact that the cell wall films consist of spherical foam glass are taken into account.
The centre surface of the wall films of the “BETA” model polyhedron relating to the volume unit is
60)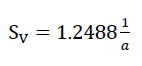
Here a is the length, which is used to describe the base polyhedra of the cell structure, which form the centre surfaces of the cell wall films of the model foam glass. If the plateau edges with the radius r and the penetration of the planar cell wall films of thickness in the area of their common “intersection lines” are disregarded, algebraically this results in the component of the overall porosity n = 1- of a body made of “BETA” model foam glass which reduces on the polyhedral cell bubbles included by the spherical foam glass cell wall films to
61)nz=n⋅ω=1−SV⋅t
If however, we still take into account the influence of the assumed circular cylindrical-shaped plateau edges with the circular cylinder radius (see Fig. no. 14), then the expression results in
62)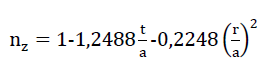
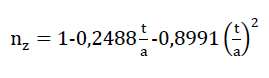
For the same reasons as with the “TOP” model foam glass, here the radii of the circular cylindrical-shaped plateau edges are also assumed at r = 2t. This allows formula No. 62 to be simplified to the expression
63)
Based on this relationship, and the relationship resulting from formula No. 4 in chapter A
64)n=n*+(1-n*)⋅nz
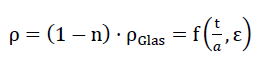
between the porosity n of the polyhedron foam glass and its parameters n* and nz, the density of the polyhedron foam glass “BETA” is
65)
As the layout and elevation in Fig. No. 36 show, the cell structure formed of the centre surfaces of the cell wall films of the “BETA” model foam glass can be described not only by its congruent elementary polyhedra (β - hedron), but also by a legitimate arrangement of many congruent sub-units. Fig. No. 37 shows such a sub-unit!
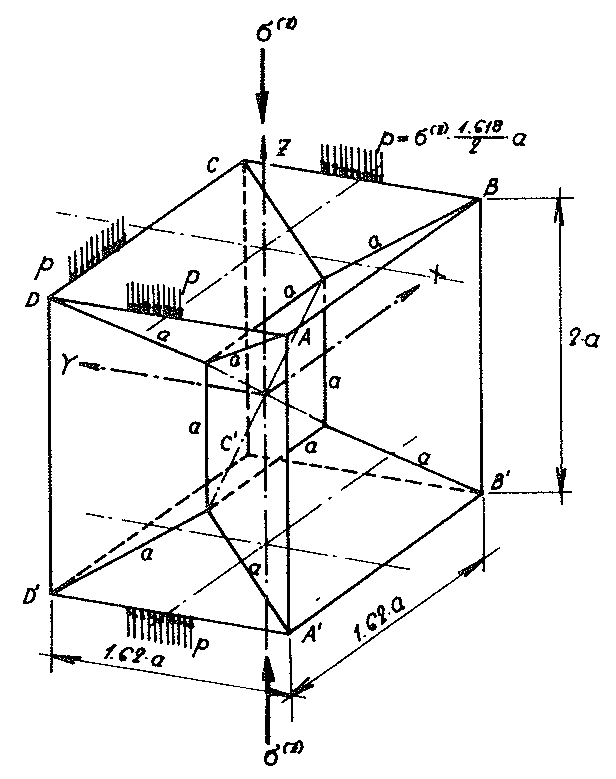
Fig. No. 37 Sub-unit of the “BETA” model foam glass
For reasons of simplicity, the peripherally unconstrained model foam glass body should only be loaded by the surface load σ(z) unconstrained in x- and y-direction (see Fig. No. 37)!
With σ(z) each sub-unit formed from the cell structure of the “BETA” model foam glass experiences a rigid body displacement and shape changes as a whole. Since all sub-units are equal, every coordinate system x,y,z connected with such a sub-unit can be considered to be at rest. Then the above shape changes can be construed as relative displacements versus the system x,y,z.
An observer can see (see Fig. no. 36) that before, during and after loading with σ(z)
- 1)the vertical edges (z.g.
 ) of the sub-units lie on two-fold rotational axes and their
- 2)vertices A, B, C, D and A’, B’, C’, and D’ each define a square.
These two facts also show how with the loading σ(z) each vertical edge of the sub-unit remains straight and can only be displaced relatively within the plane determined by the origin of the coordinate system x,y,z connected with the sub-unit and its original position.
As with the “TOP” model polyhedron foam glass in section No. 1.3.2 the vertical edges of the sub-unit of the “BETA” model (e.g. ), which in any case lie on two-fold rotational axes, can be treated as so-called jointed lines. They coincide with the vertical diagonals of the regular hexagons formed from the centre surfaces of the vertical hexagonal cell wall films. Thus with the external load σ(z) the vertical edges (e.g. ) of the associated material sub-units - see Fig. No. 37 - per length unit are only loaded by the variable normal forces mξη and the variable torsional moments mξ and shear forces qξ vwhilst the bending moments disappear1).
For further consideration, the sensible assumption has been made that the edges of the sub-unit, which form the sides of the squares ABCD and A'B'C'D' lay on jointed lines! As a result of this arbitrary assumption, which does not match exactly with reality, at the horizontal edges of the associated material sub-unit (e.g. ) only variable normal forces n̅ξ, variable torsional moments m̅ξη and shear forces q̅ξ act (see Fig. no. 38).
According to the above, this all horizontal and vertical edges of the material sub-unit of the “BETA” model foam glass as with the “TOP” model can be reinforced with fictitious edge beams (EF=0,GJP=0,EJ=∞)2), without any dependencies resulting. In the case of the horizontal fictitious edge beams, this of course only applies approximately. If such a reinforced material sub-unit is imagined to be cut from the “BETA” model foam glass, then these edge beams - as with the “TOP” model - these edge beams constrain their geometric compatibility with the other reinforced material sub-units of the foam glass, whereby the stress- and deformation states in the material sub-unit are not influenced.
- 1)Same considerations as with the “TOP” model
- 2)In relation to the coordinate system bound to the sub-unit x,y,z these vertical edge beams a priori only possess one degree of freedom.
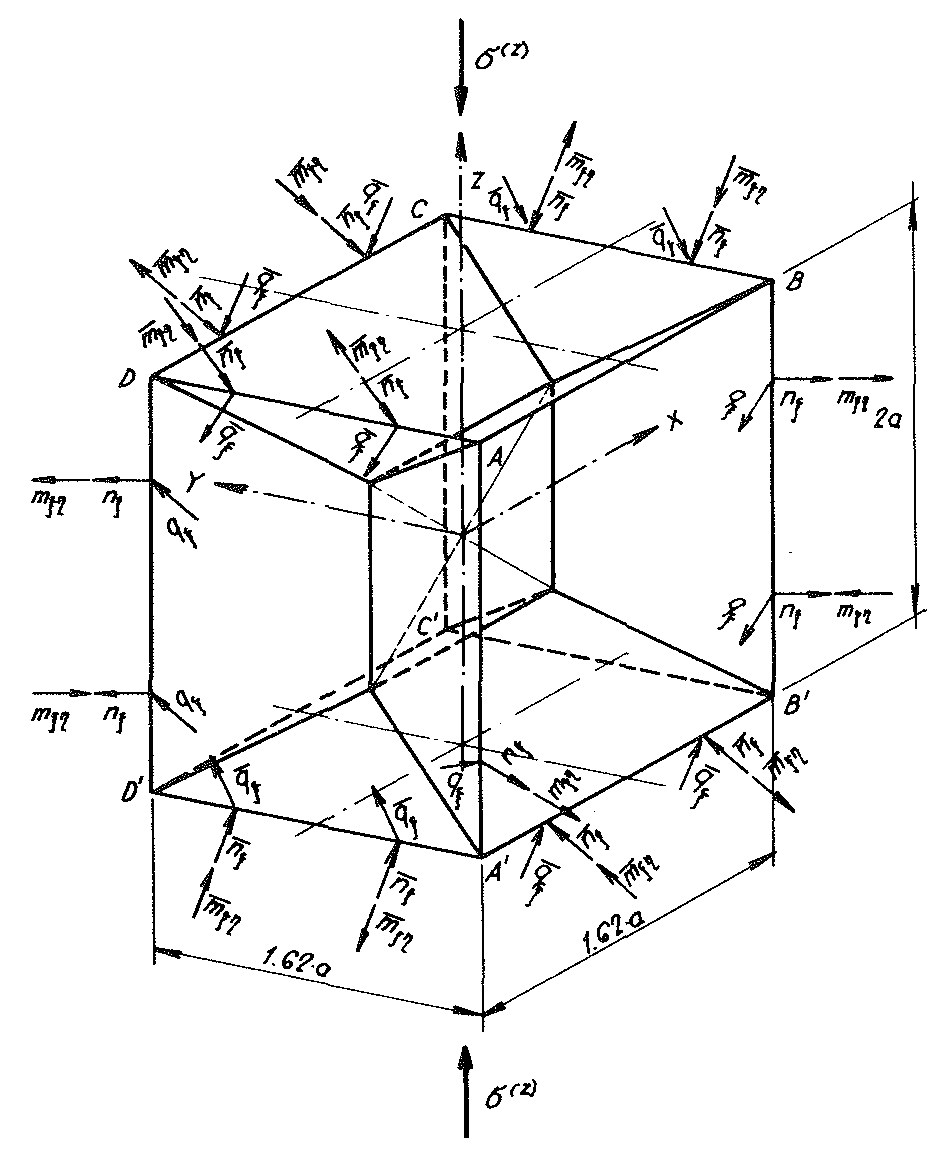
Fig. no. 38 The intersecting forces acting on the material sub-unit of the “BETA” model foam glass under the external loading σ(z)
Analogous to the “TOP” model, for the determination of the stresses in the reinforced material sub-unit only the vertical line loads acting on their horizontal edges (e.g. )
66)
need to be taken into account.
In accordance with the surface hypothesis in section No. 1.3.1 of this chapter σ(z) can then be equated to the compressive strength or the tensile strength of the “BETA” model foam glass, as soon as the largest main tensile stress at any point in the inner surface of its polyhedron bubbles reaches the fracture strength σB(n∗) of its cell wall films of spherical foam glass treated as a continuum. For this reason, for the determination of the fracture strengths and the stress conditions on the surfaces of the cell walls need to be known exactly. The stress analyses required for this could be limited to an “eighth” of the reinforced material sub-unit by using the symmetries. This was divided into 528 finite elements for the numerical stress proofs and represented in Fig. no. 39.
As the equations no. 1, no. 26 and no. 63 prove, the relationship between the thickness and the length , which describes the base polyhedron of the “BETA” model foam glass, depends only on its density ρ and on the porosity n∗ of its spherical foam glass cell wall films. This relationship however significantly influences the proportion of the bending plane stresses on the surfaces of the cell wall films, when at small the membrane stress condition dominates, and with large the bending effect is strongly felt (see diagram on Fig. No. 48). For these reasons, the decisive influence of the fracture behaviour of the “BETA” model polyhedron foam glass through the relationship =f (ρ,n∗) and the tensile strength (n∗ = 0) of the spherical foam glass cell wall film glass base material (surface hypothesis) can be concluded. For the execution of the numeric stress analyses, which form the basis of the predictions of the “BETA” model polyhedron foam glass fracture strengths, based on the above only the relationship =f (ρ,n∗) when setting the parameter n∗ to zero need be varied , since the corresponding values for other n∗≠0 can be recalculated proportionally due to the surface hypothesis.
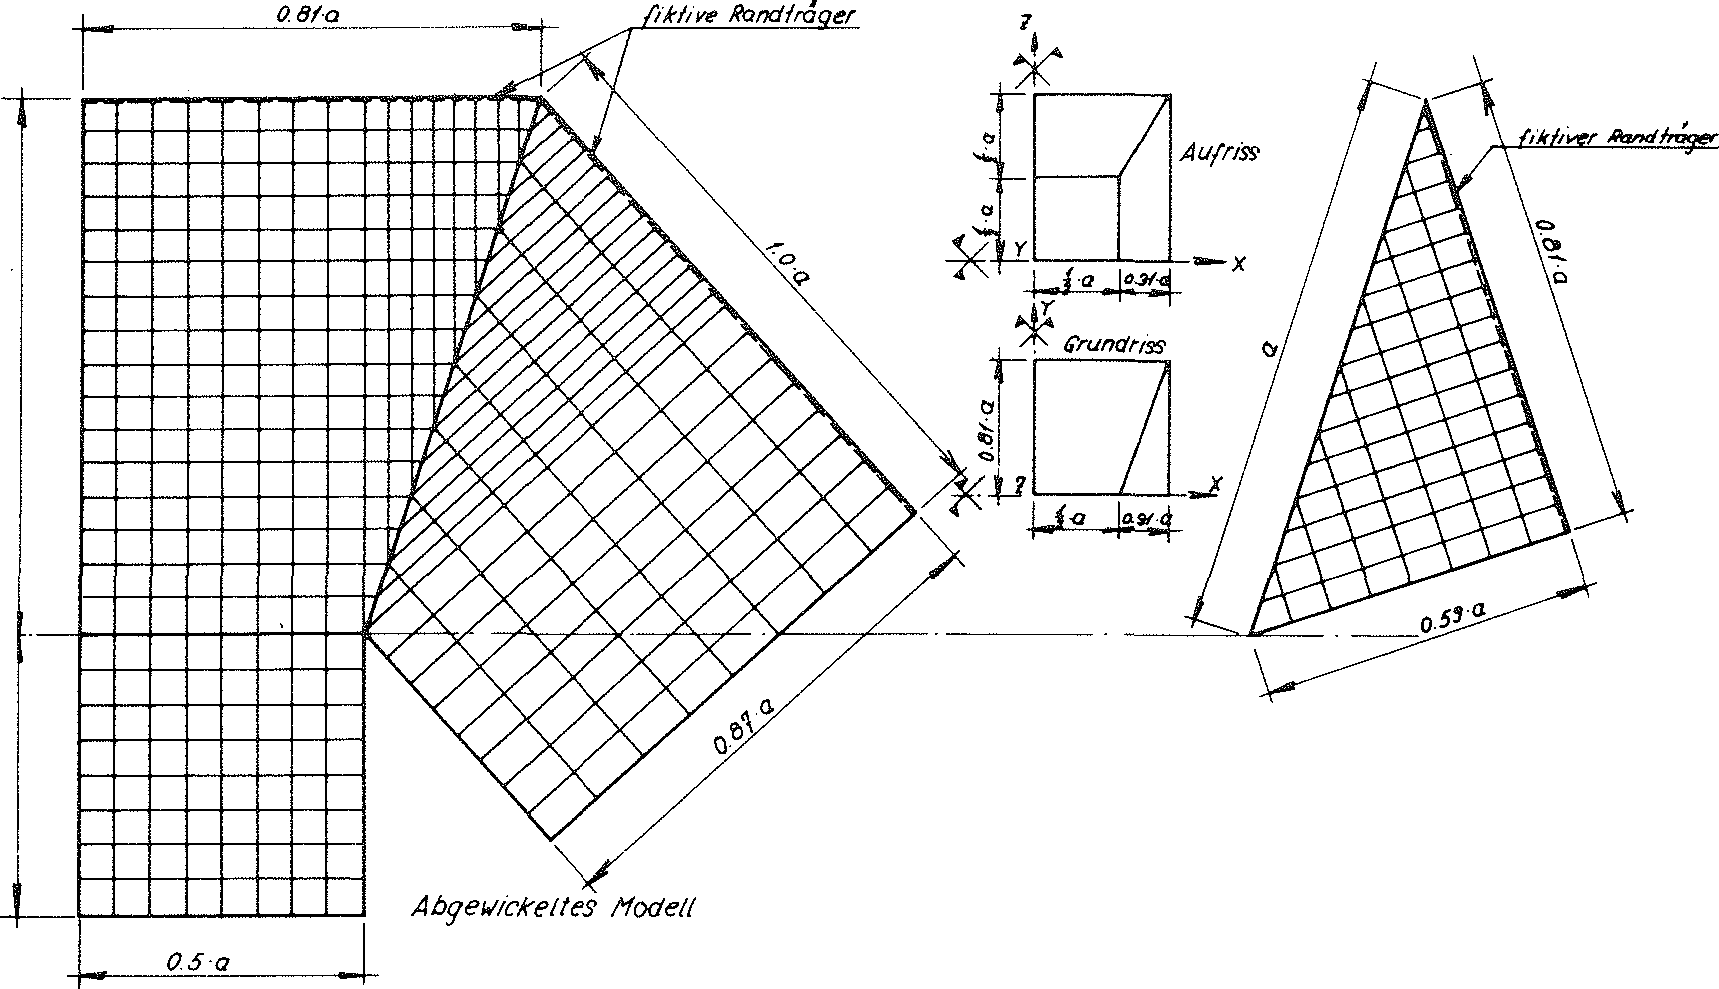
Fig. No. 39 Division of the reinforced material sub-unit of the “BETA” model foam glass reduced by the use of the symmetries into 528 finite elements
The tensile strengths, the moduli of elasticity and the Poisson’s ratios of the spherical foam glass cell walls treated as a continuum were assumed according to section No. 1.3.1 as
67)
68)E(n∗)=E(n∗=0)⋅𝚎−3.95n∗=72′600⋅𝚎−3.95n∗
and
69)ν(n∗)=ν(n∗=0)=0.21
angenommen.
In the table on page no. 79 the calculation results are summarised. Fig. no. 40 shows the results of these calculations as a diagram. This shows, that the density ρ of the model foam glass exerts a determining influence on the fracture strengths and whereas in contrast this can no longer be so clearly stated regarding the porosity n∗ of the spherical foam glass cell wall films.
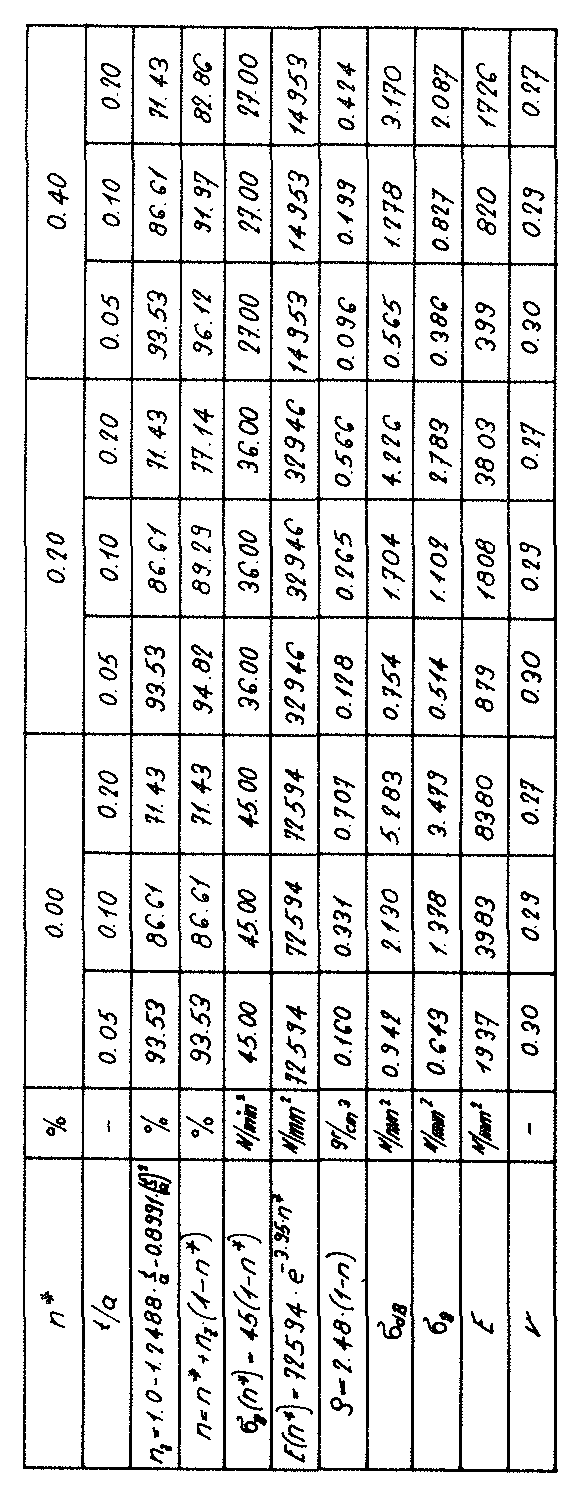
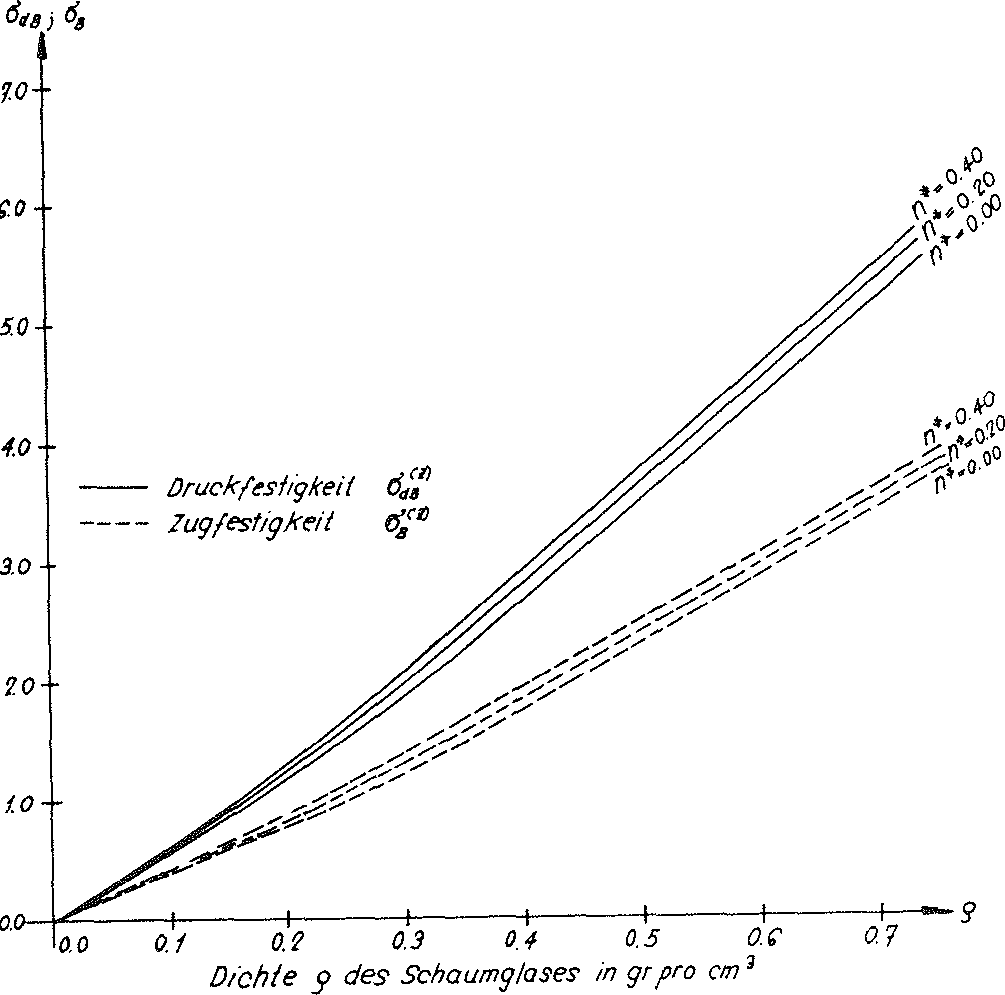
Fig. No. 40 The fracture strengths of the “BETA” model polyhedron foam glass.
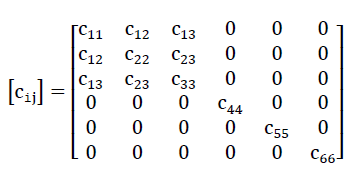
As already stated in section No. 1.3.3.1, the symmetry elements of the “BETA” model foam glass form the point group (crystal class) mmm or 2/mm. As a consequence the symmetrical matrix (cij) of the moduli of elasticity cij according to the Neumann Principle (see section No. 1.3.2.2.4) has the following structure:
71)
Layout and elevation of the cell structure of the “BETA” model foam glass on Fig. No. 36 show a layer structure (ABABA ...); in direction z a layer A of β -hedrons, whose x1-axes (see Fig. No. 35) are aligned in direction x of the space always alternates with a layer B of β -hedrons, whose x1- axes point in direction y of the space.
As a consequence of the morphology of its cell structure described above, with the “BETA” model foam glass only equal mechanical behaviours are to be expected with reference to the directions x and y of the space. Based on this fact between the elements cij of the matrix (cij) the relationships
c11=c12;c13=c23 and c44=c55 .
The matrix of the moduli of elasticity cij wthen has the following simplified structure
72)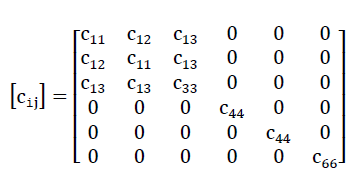
A single crystal, whose symmetry elements form the point group of crystal class 4/mmm a matrix (cij), which has the same element structure!
Despite the fact that the elasticity of the “BETA” model foam glass can only be described exactly by the six moduli of elasticity
c11,c33,c44,c66,c12 und c13
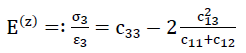
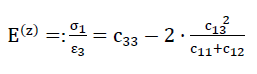
for the purpose of our rough estimates, only the external loading σ(z)=−σ3 induced values
73)
74) und
und
75)
were determined from calculations.
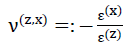
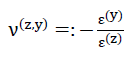
Here the following equations apply:
- 1)σ3=−σ(z)
- 2)ε3=ε(z)
- 3)ε(x)=ε(y)=ε1=εz
- 4)ν(z,x)=ν(z,y)
In the following statements the values E(z) and ν(z,x) = ν(z,y) should be described as the modulus of elasticity or as Poisson’s ratio of the model foam glass!
In the table on page 79 the values E(z) and ν(z,x)=ν(z,y) determined simultaneously with the fracture strengths for the material sub-unit were also entered. The Figs. No. 41 and No. 42 show the graphs E(z)(ρ,n∗) and ν(z,x)(ρ,n∗)=ν(z,y)(ρ,n∗) for the parameters n∗=0.00, n∗=0.20 and n∗=0.40.
In the diagrams applicable for the “TOP” model on the Figs. No. 26, 27, 33 and No. 34, the graphs (ρ,n∗=0), (ρ,n∗=0), E(z)(ρ,n∗) and ν(z,x)(ρ,n∗=0)=ν(z,y)(ρ,n∗=0) of the”BETA” model polyhedron foam glass were also added.
Even though the “BETA” model foam glass was only investigated for an external surface loading σ(z) in the direction z of the space, the diagrams mentioned above show that the predictions of both “TOP” and “BETA” models are not significantly different in terms of the mechanical properties. For this reason for the future theoretical investigations only the “TOP” model foam glass should be used.
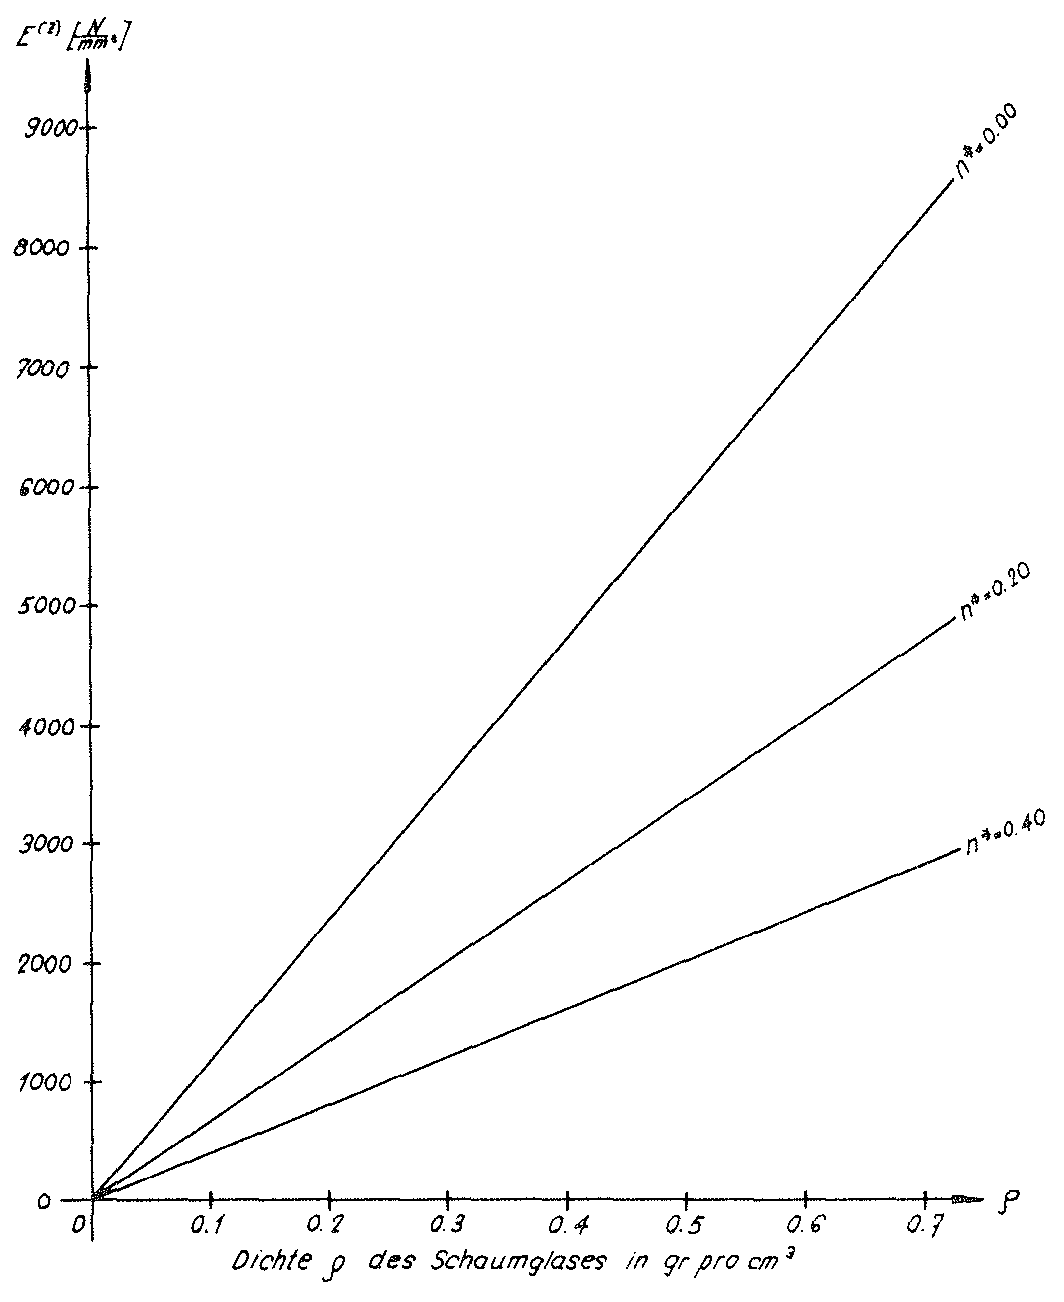
Fig. No. 41 The modulus of elasticity of the “BETA” model foam glass
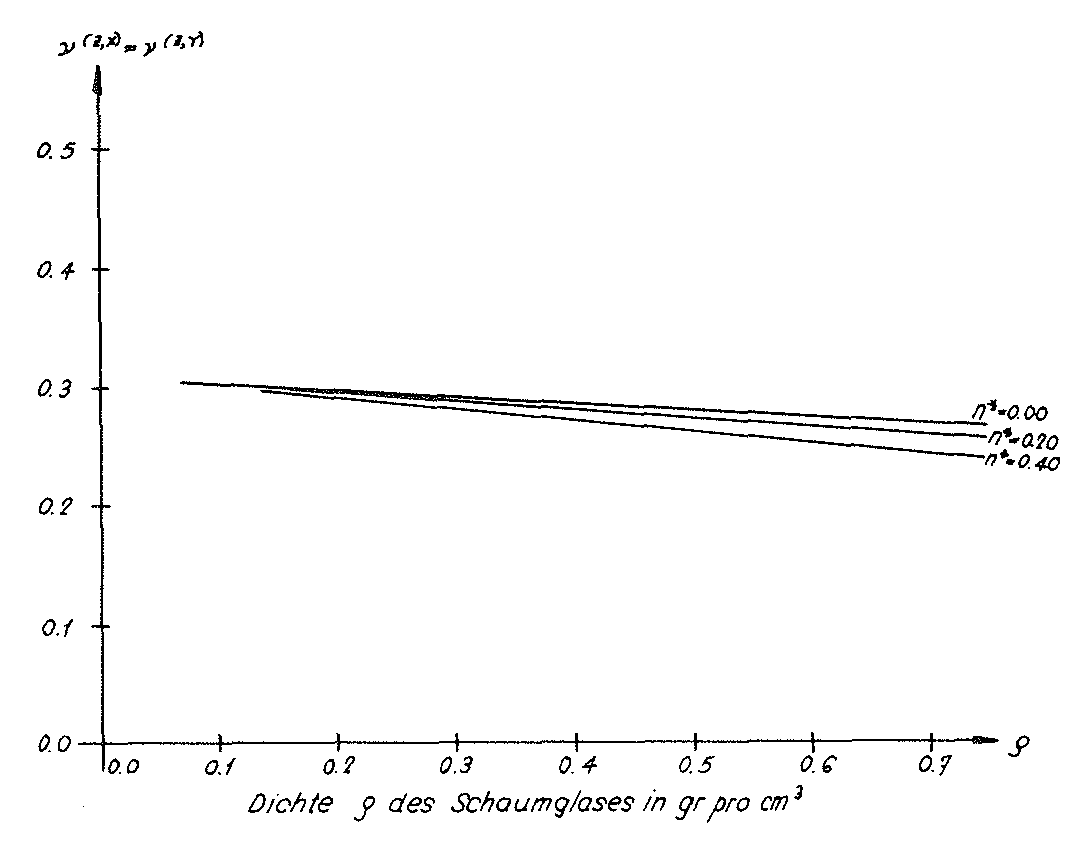
Fig. No. 42 The Poisson’s ratio of the “BETA” model foam glass
The model polyhedron foam glasses “TOP” and “BETA” considered so far are anisotropic! With a view to the possibility of producing foam glass tiles in the extrusion process, we would like to consider a new ideal polyhedron foam glass, which has a deliberate “orthotropy”1). The simplest method of creating the cell structure of such a model foam glass is through the affine transformation of the cell structure of the “TOP” model foam glass in direction z of the space (see Fig. No. 11)2),
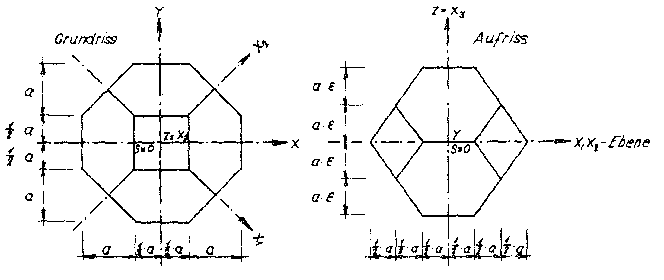
Fig. No. 43 Base polyhedron of the “ORTHO” model foam glass
Fig. No. 43 shows the layout and elevation of the elementary polyhedron of the cell structure of the new polyhedron foam glass created in this way, which will be called “ORTHO” model foam glass in short. This base polyhedron is a combination of the forms: Tetragonal dipyramid, tetragonal prism and base binacoid.
Since this is actually a tetragonal dipyramid with truncated vertices, in future we will refer to it as “Truncated Tetragonal Dipyramid”!
- 1)The word “orthotropy” is a synonym for “orthagonal anisotropy”.
- 2)Crystallographically: “Homogeneous distortion along z-axis”.
This polyhedron has the following symmetry elements:
- 1)one four-fold rotational axis coincident with the -axis (=x3-Achse);
- 2)two two-fold rotational axes lying on the coordinate axes x and y;
- 3)two two-fold rotational axes defined by the x1- and x2- axes;
- 4)five planes of symmetry, of which each intersects one of the rotational axes above perpendicular at the centre of gravity S of the base polyhedron and
- 5)one centre of symmetry.
These symmetry elements form a point group, which is described with the generally applied symbol 4/mmm and is assigned to the tetragonal crystal system. The point group 4/mmm of course also applies for the “ORTHO” model foam glass body unconstrained on all sides.
Since the cell structure of the “TOP” model foam glass as a result of the affine transformation above only equates to a special form of the new model, the layout and elevation on Fig. No. 11 can also be used for the graphical representation of the “ORTHO” model foam glass.
The geometry of the cell structure of the “ORTHO” model foam glass contravenes the principles of J.Plateau (see chapter A, section 1.2)! The centre surface of the wall films of the “ORTHO” model foam glass related to the volume unit is
76)
The parameters a and ε on the right hand side of this equation were added to Fig. No. 43!
Regarding the further investigations, the plateau edges (see Fig. No. 14) were neglected and the planar cell wall films of constant thickness of the model polyhedron foam glass are assumed to be composed of compact glass base material (d.h. n∗=0).
By neglecting the influence of the penetration of each of three planar cell wall films of thickness t in the areas of their common “intersection line”
the total porosity of the “ORTHO” model foam glass is
77)n=1−Sv⋅t
Here according to equation No. 1 the density of the foam glass takes the value
78)
As with the “TOP” model foam glass, the cell structure of the “ORTHO” model foam glass can also be achieved by the periodic arrangement of many congruent “sub-units”.
Such a sub-unit is shown in Fig. No. 44.
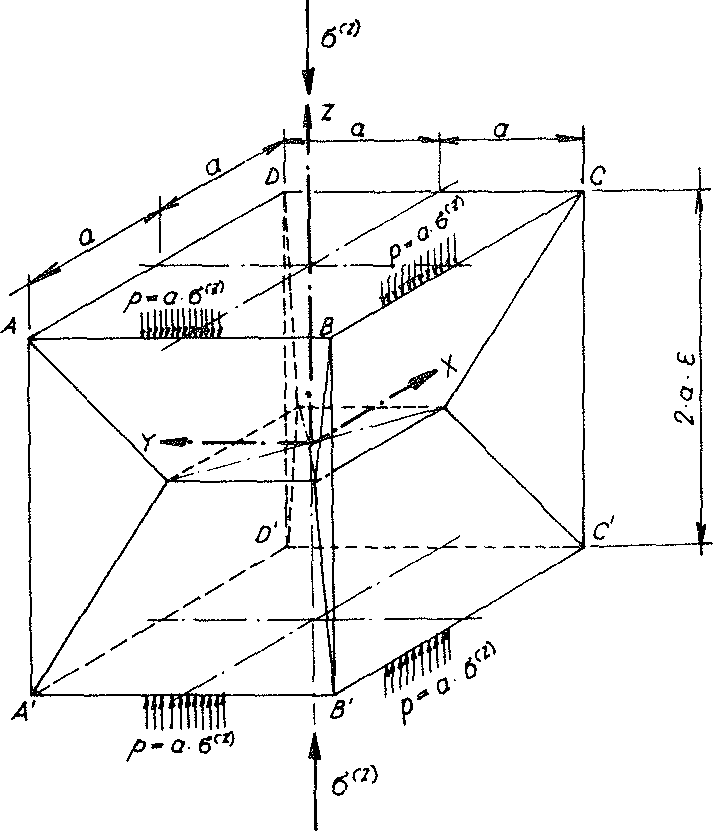
Fig. No. 44 sub-unit of the “ORTHO” model polyhedron foam glass
An observer of Fig. no. 11 can see that the two-fold nature of the rotational axes, on which all horizontal and vertical edges (e.g. ) of the sub-unit under consideration lies, is retained with the affine transformation in the direction of the z-axis (four-fold rotational axis).
Here, only the unconstrained surface load σ(z) acting on the foam glass in x- and y- direction should be considered! As a comparison with section no. 1.3.2. shows, the geometric boundary conditions (compatibility conditions) then remain unchanged at all horizontal and vertical edges of the cell structure of the “TOP” model foam glass by the affine transformation which leads to the “ORTHO” model foam glass. For this reason for the edges of the sub-units of the “ORTHO” model foam glass the same geometric boundary conditions apply as for the sub-units of the “TOP” model foam glass. For this reason, all material sub-units of the “ORTHO” model foam glass can be reinforced in exactly the same way as with the “TOP” model foam glass, by attaching fictitious edge beams.
These reinforcements do not cause any additional constraints in the model foam glass. If we imagine cutting such a reinforced model sub-unit out of the “ORTHO” model foam glass, then these edge beams constrain their geometric compatibility with the other reinforced material sub-units of the foam glass, whereby the stress- and deformation condition in the material sub-unit are not influenced.
Analogous to the “TOP” model, for the determination of the stresses in the reinforced material sub-unit only the vertical line loads acting on their horizontal edges
79)p(z)=а⋅σ(z)
are taken into account (see Fig. No. 44).
In accordance with the surface hypothesis in section no. 1.3.1, then σ(z) the compressive strength or the tensile strength dof the “ORTHO” model polyhedron foam glass reaches the highest main tensile stress on the surface when any of its cell wall films takes the value σB(n∗=0) . For this reason the edge stress conditions of the cell wall films should be known as exactly as possible!
For the required numerical stress calculations the reinforced
material sub-unit was limited to a “sixteenth” by using various planes of symmetry.
This “sixteenth” consists of 340 finite elements and was drawn on Fig. No. 25 for the special case  .
.
According to equation no. 78, the relationship between the thickness t and the length a describing the base polyhedron of the “ORTHO” model polyhedron foam glass only depends on its density ρ and the parameter ε. This relationship however significantly influences the proportion of the bending plane stresses on the surfaces of the cell wall films, when at small the membrane stress condition dominates, and with large the bending effect is strongly felt. For these reasons, it can be concluded that the fracture behaviour of the “ORTHO” model polyhedron foam glass in addition to the relationship = f (ρ,ε) is also influenced by the tensile strength (n∗=0) of the glass base material of the cell wall films - surface hypothesis - decisively.
For the stress analyses, which formed the basis of the predictions of the mechanical behaviours of the “ORTHO” model polyhedron foam glass, only the conditions = f (ρ,ε) were varied with parameter ε held constant.
The tensile strength, the modulus of elasticity, and the Poisson’s ratio of the solid glass cell wall films treated as a continuum according to section No. 1.3.1 were assumed as
E(n∗=0)=72′600 N / mm2 and
ν (n∗=0)=0.21
The notch effects at the locations, where each three cell walls intersect were neglected for the determination of the fracture strengths.
In the table on page 91, the results of the compressive and tensile strengths ( ,) determined in this was were summarised and graphically represented in Fig. No. 45.
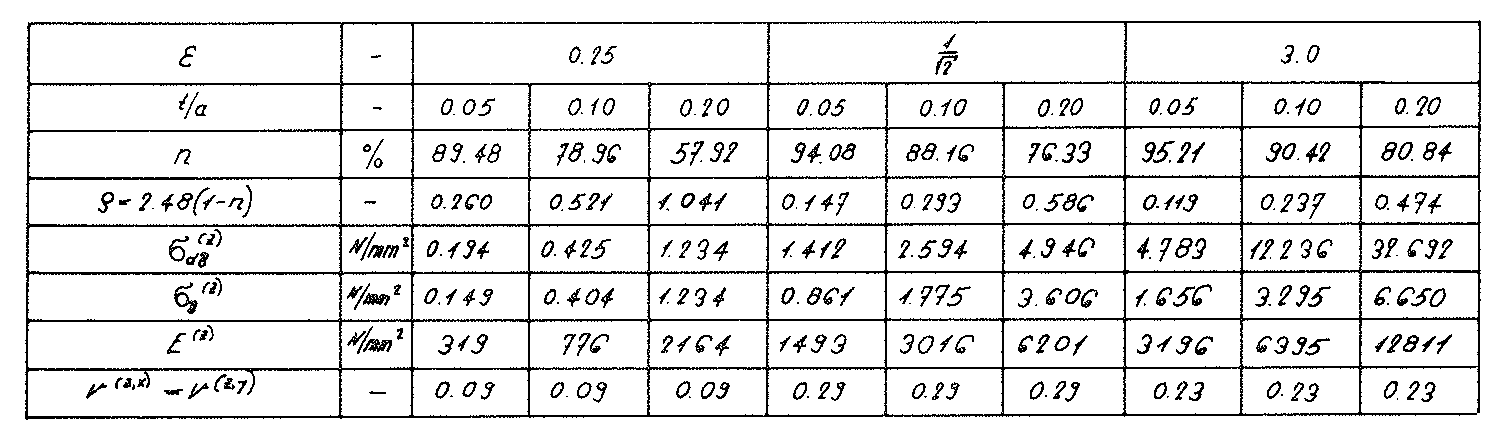
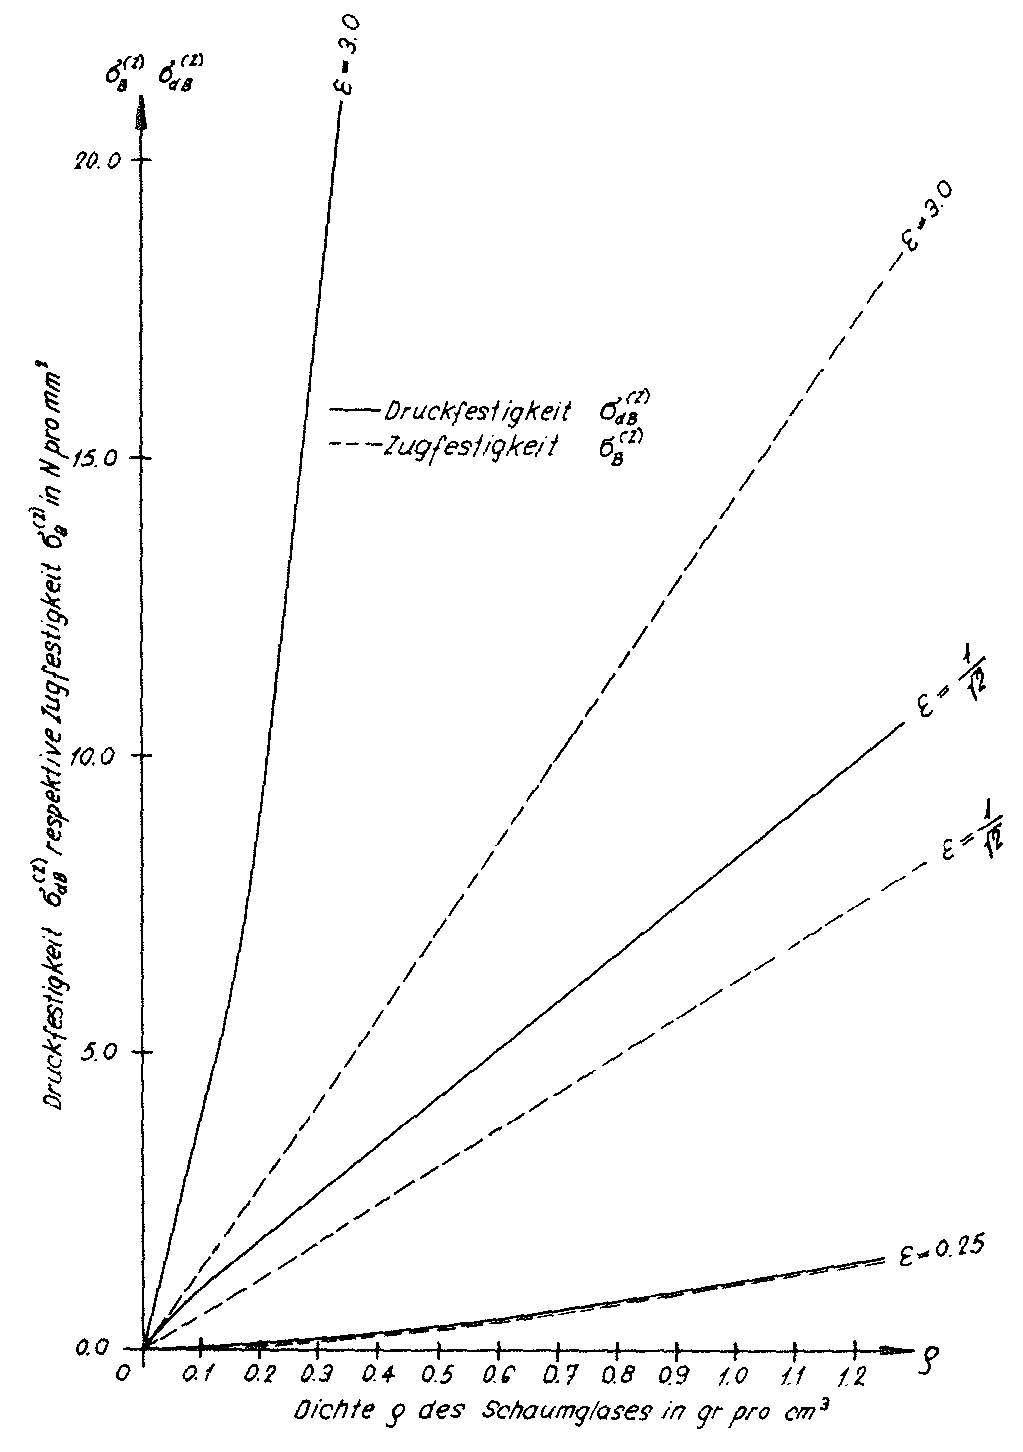
Fig. No. 45 The fracture strength of the “ORTHO” model foam glass
Since the “ORTHO” model polyhedron foam glass demonstrates a homogeneous anisotropy, regarding its elasticity, the same theory apples as for the “TOP” model in section No. 1.3.2. This means that also in the reference system x1,x2,x3 on Fig. No. 43, the relationship between the stress vector and the distortion vector can be expressed by the relationship
80)
As already stated, the symmetry elements of the “ORTHO” model foam glass form the point group (crystal class) 4 / mmm. As a consequence the symmetrical matrix (cij) of the moduli of elasticity cij according to the Neumann Principle (see section No. 1.3.2.2.4) has the following structure:
81)
Despite the fact that the elasticity of the “ORTHO” model foam glass can only be described exactly by the six moduli of elasticity c11,c12,c13,c33,c44 and c66 for our rough estimates only the values occurring under the external loading σ(z)=−σ3 being
82)
83) and
and
84)
were determined from calculations.
- 1)The vectors and were defined in section No. 1.3.2.2.4.
Here the following equations apply:
- 1)σ3=−σ(z) ;
- 2)ε3=ε(z) ;
- 3)ε(x)=ε(y)=ε1=ε2 , und
- 4)ν(z,x)=ν(z,y).
In the following statements the values E(z) and ν(z,x)=ν(z,y) should be described as the modulus of elasticity or as Poisson’s ratio of the model foam glass!
In the table on page 91 the values E(z) und ν(z,x)=ν(z,y) eingetragen. Bild Nr. 46 zeigt die Graphen E(z)(ρ,ε) and ν(z,x)(ρ,ε)=ν(z,y)(ρ,ε) determined simultaneously with the fracture strengths for the material sub-unit were also entered ε=0.25; and ε=3.0.
The diagrams in the Figs. No. 45 and no. 46 show that the fracture strengths and as well as the moduli of elasticity E(z) of the “ORTHO” model foam glass at constant density ρ increase very rapidly with the value of the parameter. This insight can of course be transferred to real strongly orthotropic polyhedron foam glasses in an appropriate way.
The example of the “ORTHO” model also indicates that with compressive loading - analogous with the standard commercial insulation blocks - foam glass insulation blocks with elongated polyhedral pores aligned in the direction of the compressive load trajectories will show optimum load bearing properties.
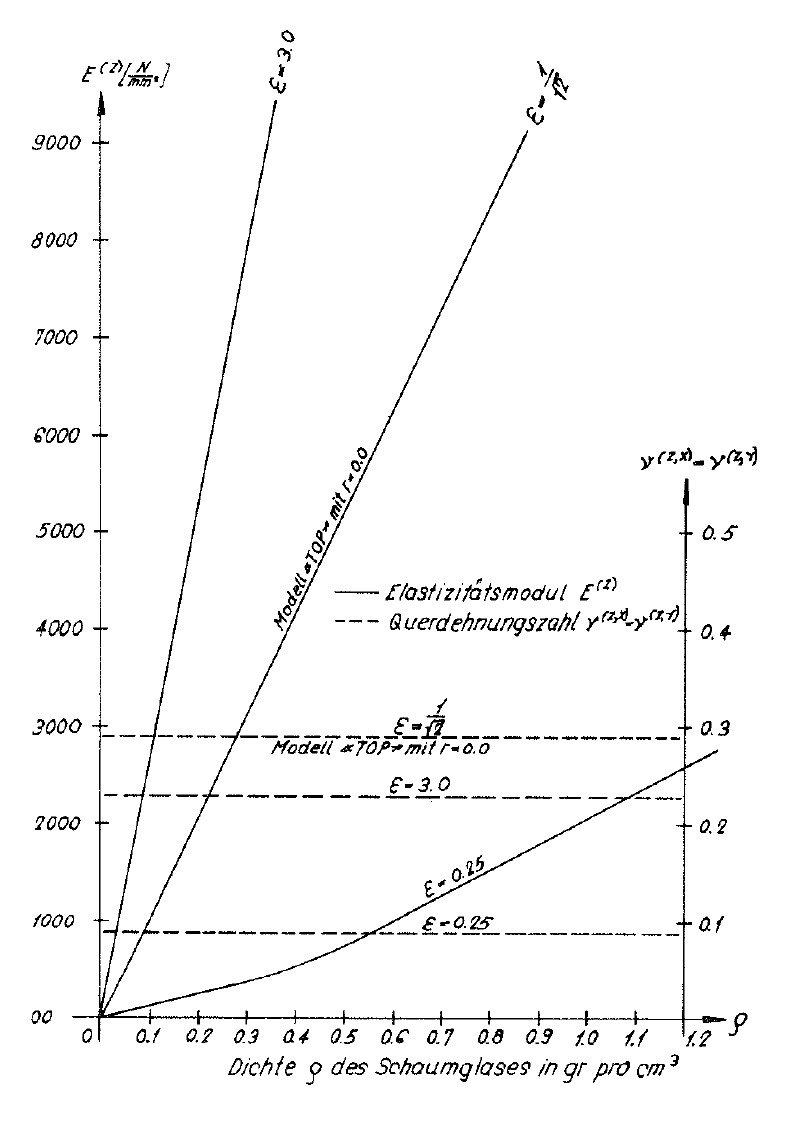
Fig. No. 46 Modulus of elasticity and Poisson’s ratio of the “ORTHO” model foam glass