Since the previously defined standard test piece has the slenderness ratio λ=10 with the dimensions set out in Fig. No. 49 and for this reason a uniaxial internal stress condition can be achieved with axial external compressive loading, this standard body was used for the test of the compressive strengths of the foam glass.
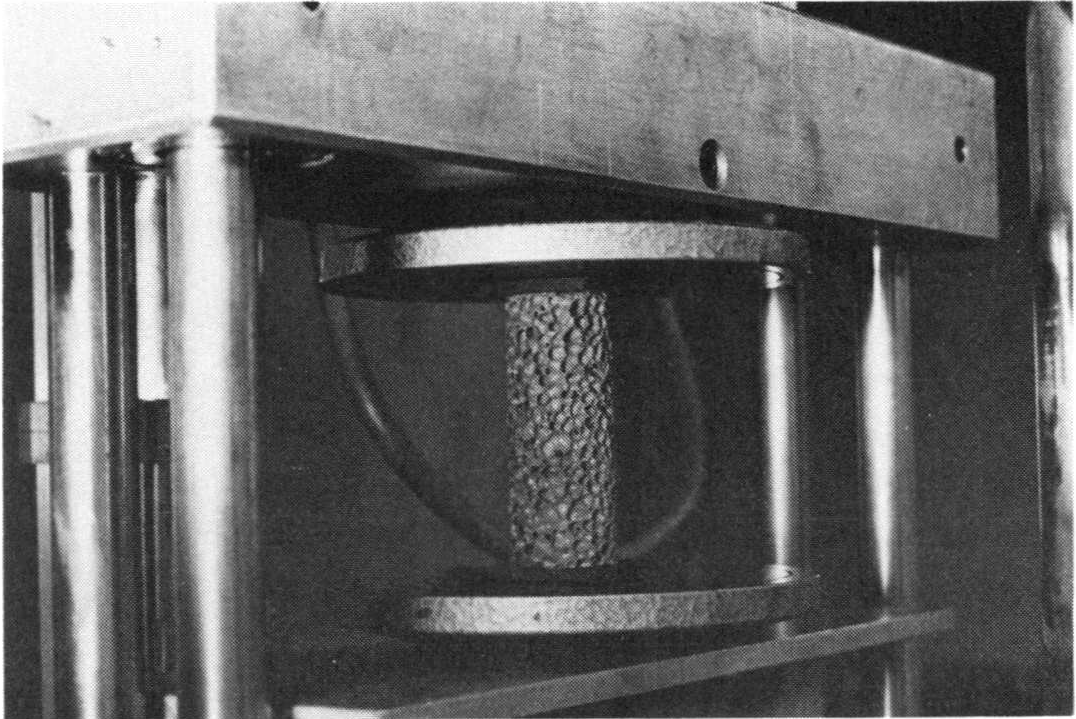
Fig. No. 50 shows a polyhedron foam glass test piece which has not yet been loaded in the loading unit of the test machine used by us. The 3 mm thick rubber plates which can be seen in the figure, located at both support surfaces of the test piece, prevent premature destruction due to uneven local compression.
In order to verify the correctness of this procedure, compression tests were also carried out with the thickness of the neoprene rubber support plates being varied. Here it was possible to determine that changes in thickness of the rubber support plates have no significant impact on the results of the compressive strengths. The test pieces which were not fitted with rubber support plates fared very poorly.

Fig. No. 50 Test pieces made of polyhedron foam glass in the loading unit for compression test
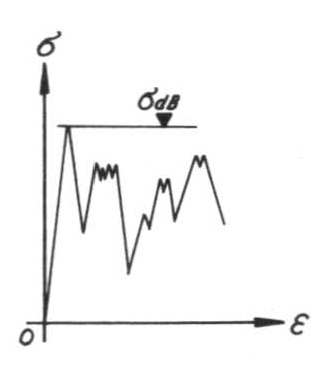
During the test of the compressive strengths σdB of the foam glass, the test always begins with the strains ε causing a linear increase in the compressive stresses σ in the test piece up to a sudden unannounced fracture at σdB, which can be seen in the associated stress - strain diagram Fig. no. 51 with a concurrent sharp drop in the compressive load.

Fig. No. 51 Stress - strain diagram during the compression test
If the test process is then continued without interruption, then the test piece is crushed with a constant crackling noise, and with the applied compressive loads constantly varying around a lower level than the compressive strength σdB .
Through compression tests on test pieces with different geometries, is was possible to determine that their shape and size exert a not insignificant influence on their compressive strengths! For this reason, the compressive strengths measured in this was should only be considered as comparison values.
During the test process the velocity of the steel support plates shown in Fig. No. 50 was 1.2 mm per minute.
Special mention must also been given to the findings of how the linear stress-strain behaviour observed during every compression test up to fracture confirms the theoretically predicted validity of the linear-elastic fracture mechanics for the foam glass within the limits of measurement accuracy.
Table no. 1 contains the compressive strengths of the fine-celled polyhedron foam determined using the test method described above. From sixteen of the related pairs of values of density and strength included which were subjected to a non-linear regression analysis, for the fine-celled polyhedron foam glass we get the regression
87)σdB=16.24⋅ρ1,57+1.10
which relates the compressive strength σdB (N / mm2) with the density ρ (gr / cm3) and whose graph was entered on Fig. No. 26. The regression however is only assured in range 0.29 < ρ < 0.52gr / cm3. The tables No. 2 and No. 3 contain the observed compressive strengths of the foam glass types 1 and 2 using our standard method. The test results for the sample series of foam glass type 1can be summarised with the regression equation.
88)σdB=10.96⋅ρ1,07⋅e(0,0042 n∗-0.336 L̅3)+0.22
Here σdB (N/mm2) mean the compressive strengths, ρ (gr/cm3) the density, n∗(0/0) the porosity of the cell wall films and L̅3(mm) die "Mittleren Abschnittslängen" der Schaumglasart 1. the “mean section lengths” of the foam glass type 1. The regression is assured in the intervals
- 0.26 ≤ ρ≤ 0.39gr / cm3,
- 21 ≤ n∗ ≤ 4 2% and
- 1.9 ≤ L̅3 ≤ 3.8 mm
for the independent arguments.
Analogously for the sample series of the foam glass type 2 the following formula applies
89)σdB=20.43⋅ρ2.89⋅𝚎(0.021 n∗-0.00016 L3)+0.74
Here, the following applies:
- 0.26 ≤ ρ ≤ 0.34gr / cm3 ,
- 15 ≤ n∗ ≤ 26% und
- 1.9 ≤ L̅3 ≤ 2.6mm.
In the diagram on Fig. No. 26 the points were also entered, which belong to the test body, whose measured parameters σdB,ρ,n∗ and L̅3 were included into the regression analyses leading to the formulae No. 88 and No. 89.
As was stated in section No. 2 of chapter A, for the fine-celled polyhedron foam glasses and the samples of type 2 - which were all expanded at comparatively low temperatures - a clear regression exists between the density ρ and the parameters n∗ and L̅3. For the values n∗ with relatively high expansion temperature profiles of the samples of foam glass type 1 however this no longer applies.
On the basis of these observations the hypothesis can be put forward that the structure (n∗=n∗(ρ),L̅3=L̅3(ρ)) and therefore also the mechanical behaviour of given polyhedron foam glass types expanded at low temperature only depends in the main on their density ρ whilst this no longer applies with reference to the types expanded with relatively high temperature profiles (n∗≠n∗(ρ),L̅3=L̅3(ρ)).
With the above statements regarding the empirically determined relationships between the parameters n∗ and L3 of samples of different polyhedron foam glass types and their density as well as with the general dependency established with the aid of a comparison of the regression equations No. 87, 88 and 89
90)σdB=f (ρ,n∗,L̅3)
the above hypothesis can be confirmed.